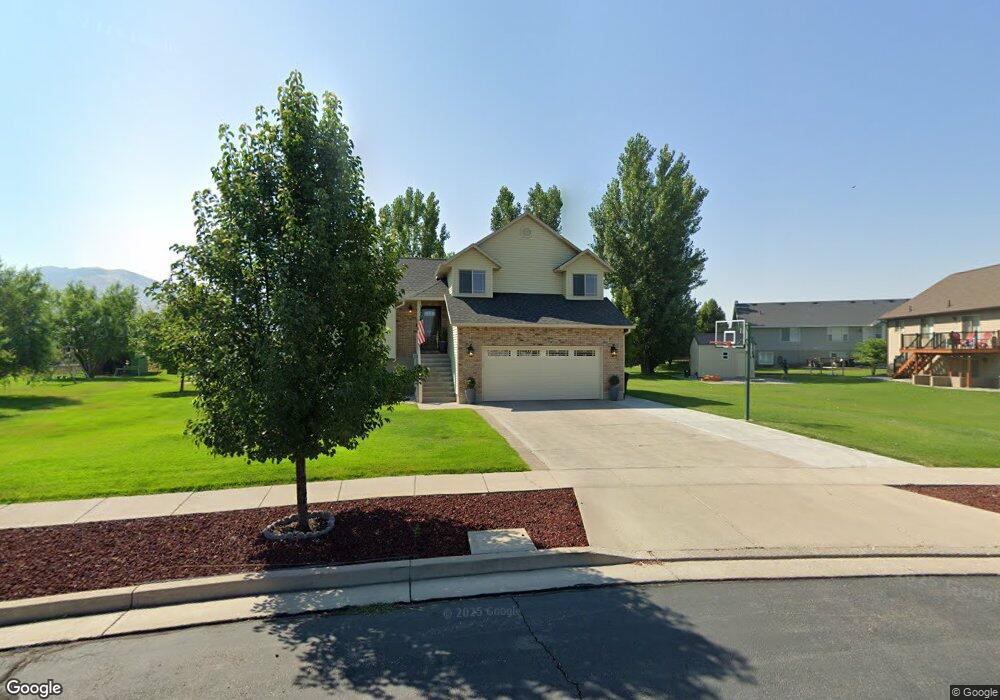
754 W 2280 S Nibley, UT 84321
Estimated Value: $470,000 - $507,169
3
Beds
2
Baths
2,560
Sq Ft
$189/Sq Ft
Est. Value
About This Home
This home is located at 754 W 2280 S, Nibley, UT 84321 and is currently estimated at $484,042, approximately $189 per square foot. 754 W 2280 S is a home located in Cache County with nearby schools including Nibley School, Spring Creek Middle School, and South Cache Middle School.
Ownership History
Date
Name
Owned For
Owner Type
Purchase Details
Closed on
Dec 23, 2020
Sold by
Boston Daniel A and Boston Traci S
Bought by
Odong Enoobong
Current Estimated Value
Home Financials for this Owner
Home Financials are based on the most recent Mortgage that was taken out on this home.
Original Mortgage
$190,000
Outstanding Balance
$169,458
Interest Rate
2.8%
Mortgage Type
Seller Take Back
Estimated Equity
$314,584
Purchase Details
Closed on
Apr 17, 2008
Sold by
Aspen Homes Development Inc
Bought by
Boston Daniel A and Boston Traci S
Home Financials for this Owner
Home Financials are based on the most recent Mortgage that was taken out on this home.
Original Mortgage
$151,920
Interest Rate
5.99%
Mortgage Type
New Conventional
Purchase Details
Closed on
Mar 9, 2007
Sold by
Bridgerland Investment Group Llc
Bought by
Aspen Homes Development Inc
Home Financials for this Owner
Home Financials are based on the most recent Mortgage that was taken out on this home.
Original Mortgage
$120,000
Interest Rate
6.31%
Mortgage Type
Construction
Create a Home Valuation Report for This Property
The Home Valuation Report is an in-depth analysis detailing your home's value as well as a comparison with similar homes in the area
Home Values in the Area
Average Home Value in this Area
Purchase History
| Date | Buyer | Sale Price | Title Company |
|---|---|---|---|
| Odong Enoobong | -- | Inwest Title Svcs Inc Logan | |
| Boston Daniel A | -- | Mountain View Title | |
| Aspen Homes Development Inc | -- | Cache Title Company |
Source: Public Records
Mortgage History
| Date | Status | Borrower | Loan Amount |
|---|---|---|---|
| Open | Odong Enoobong | $190,000 | |
| Previous Owner | Boston Daniel A | $151,920 | |
| Previous Owner | Aspen Homes Development Inc | $120,000 |
Source: Public Records
Tax History Compared to Growth
Tax History
| Year | Tax Paid | Tax Assessment Tax Assessment Total Assessment is a certain percentage of the fair market value that is determined by local assessors to be the total taxable value of land and additions on the property. | Land | Improvement |
|---|---|---|---|---|
| 2024 | $2,355 | $293,120 | $0 | $0 |
| 2023 | $2,464 | $287,155 | $0 | $0 |
| 2022 | $2,565 | $287,155 | $0 | $0 |
| 2021 | $1,807 | $314,111 | $65,000 | $249,111 |
| 2020 | $1,701 | $281,619 | $65,000 | $216,619 |
| 2019 | $1,784 | $281,619 | $65,000 | $216,619 |
| 2018 | $1,526 | $234,910 | $41,500 | $193,410 |
| 2017 | $1,522 | $124,135 | $0 | $0 |
| 2016 | $1,539 | $99,060 | $0 | $0 |
| 2015 | $1,220 | $99,060 | $0 | $0 |
| 2014 | $1,192 | $99,060 | $0 | $0 |
| 2013 | -- | $99,060 | $0 | $0 |
Source: Public Records
Map
Nearby Homes
- 2269 Clear Creek Rd
- 1045 W 2400 S
- 2313 S 1000 W Unit 110
- 2615 S 600 W
- 2662 S 850 W
- 2243 S 1120 W Unit 58
- 2205 S 1120 W Unit 62
- 2203 S 1150 W Unit 43
- Briarwood Plan at Firefly Estates
- Phoenix Plan at Firefly Estates
- Hailey Plan at Firefly Estates
- Stansbury Plan at Firefly Estates
- Monroe Plan at Firefly Estates
- Chateau Plan at Firefly Estates
- Alpine Plan at Firefly Estates
- Gala Plan at Firefly Estates
- McIntosh Plan at Firefly Estates
- Madison Plan at Firefly Estates
- 3074 S 800 W
- 1065 W 2740 S
- 2306 S 770 W
- 749 W 2280 S
- 2285 S 770 W
- 2285 S 770 W Unit 67
- 765 W 2280 S
- 2320 S 770 W Unit 57
- 2320 S 770 W
- 2297 S 770 W
- 724 W 2280 S Unit 61
- 724 W 2280 S
- 733 W 2280 S
- 2313 S 770 W
- 2327 S 770 W
- 717 W 2280 S
- 2334 S 770 W
- 2327 Clear Creek Cir
- 712 W 2280 S Unit 62
- 712 W 2280 S
- 2341 S 770 W Unit 71
- 2341 S 770 W