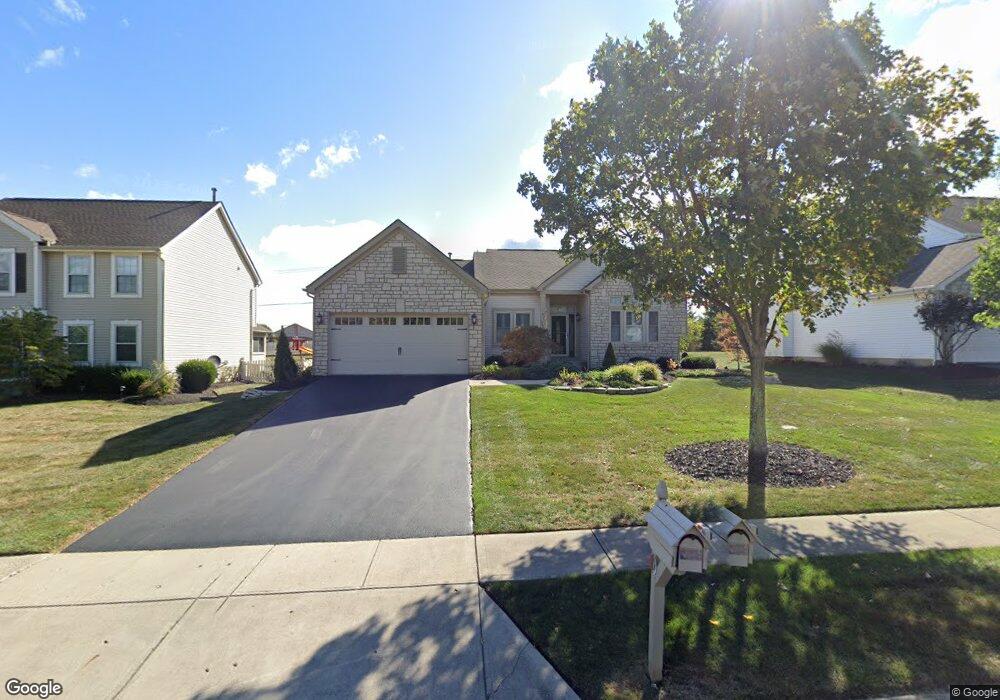
7543 Crossing Place Lewis Center, OH 43035
Orange NeighborhoodEstimated Value: $432,000 - $470,000
3
Beds
3
Baths
1,746
Sq Ft
$257/Sq Ft
Est. Value
About This Home
This home is located at 7543 Crossing Place, Lewis Center, OH 43035 and is currently estimated at $448,572, approximately $256 per square foot. 7543 Crossing Place is a home located in Delaware County with nearby schools including Oak Creek Elementary School, Olentangy Orange Middle School, and Orange High School.
Ownership History
Date
Name
Owned For
Owner Type
Purchase Details
Closed on
Jul 9, 2001
Sold by
Benjamin Kelli L
Bought by
Fout James F and Fout Judy M
Current Estimated Value
Home Financials for this Owner
Home Financials are based on the most recent Mortgage that was taken out on this home.
Original Mortgage
$50,000
Outstanding Balance
$19,353
Interest Rate
7.2%
Mortgage Type
New Conventional
Estimated Equity
$429,219
Purchase Details
Closed on
Jan 8, 1999
Sold by
R & S Real Estate Tns
Bought by
Rockford Homes Inc
Purchase Details
Closed on
Mar 10, 1998
Sold by
Rockford Homes Inc
Bought by
Benjamin Kelli L and Doon Keary M
Home Financials for this Owner
Home Financials are based on the most recent Mortgage that was taken out on this home.
Original Mortgage
$160,000
Interest Rate
8.75%
Mortgage Type
New Conventional
Purchase Details
Closed on
Jun 22, 1995
Sold by
Trst Donald R Kenney
Bought by
R & S Real Estate Ptns
Home Financials for this Owner
Home Financials are based on the most recent Mortgage that was taken out on this home.
Original Mortgage
$1,200,000
Interest Rate
7.9%
Mortgage Type
New Conventional
Create a Home Valuation Report for This Property
The Home Valuation Report is an in-depth analysis detailing your home's value as well as a comparison with similar homes in the area
Home Values in the Area
Average Home Value in this Area
Purchase History
| Date | Buyer | Sale Price | Title Company |
|---|---|---|---|
| Fout James F | $185,900 | -- | |
| Rockford Homes Inc | $75,000 | -- | |
| Benjamin Kelli L | $177,778 | -- | |
| R & S Real Estate Ptns | $745,200 | -- |
Source: Public Records
Mortgage History
| Date | Status | Borrower | Loan Amount |
|---|---|---|---|
| Open | Fout James F | $50,000 | |
| Previous Owner | Benjamin Kelli L | $160,000 | |
| Previous Owner | R & S Real Estate Ptns | $1,200,000 |
Source: Public Records
Tax History Compared to Growth
Tax History
| Year | Tax Paid | Tax Assessment Tax Assessment Total Assessment is a certain percentage of the fair market value that is determined by local assessors to be the total taxable value of land and additions on the property. | Land | Improvement |
|---|---|---|---|---|
| 2024 | $6,227 | $122,720 | $31,260 | $91,460 |
| 2023 | $6,285 | $122,720 | $31,260 | $91,460 |
| 2022 | $5,312 | $86,810 | $18,380 | $68,430 |
| 2021 | $5,342 | $86,810 | $18,380 | $68,430 |
| 2020 | $5,368 | $86,810 | $18,380 | $68,430 |
| 2019 | $4,420 | $75,400 | $18,380 | $57,020 |
| 2018 | $4,440 | $75,400 | $18,380 | $57,020 |
| 2017 | $2,300 | $72,070 | $15,190 | $56,880 |
| 2016 | $4,493 | $72,070 | $15,190 | $56,880 |
| 2015 | $4,099 | $72,070 | $15,190 | $56,880 |
| 2014 | $4,158 | $72,070 | $15,190 | $56,880 |
| 2013 | $4,037 | $68,850 | $15,190 | $53,660 |
Source: Public Records
Map
Nearby Homes
- 7698 Gladshire Blvd
- 0 E Orange Rd
- 1955 Royal Oak Dr
- 2375 Cross Creek Ct
- 7959 S Old State Rd
- 1923 Myrtle St
- 7787 Holderman St
- 1143 Little Bear Place
- 1245 Little Bear Loop
- 7631 Pleasant Colony Ct
- 8101 Orange Station Loop
- 1798 Aurora Ave
- 1520 Aniko Ave
- 2771 Abbey Knoll Dr
- 1915 Myrtle St
- 2515 Coltsbridge Dr
- 1811 Ivy St
- 8061 Cranes Crossing Dr
- 5654 Hickory Dr
- 1746 E Powell Rd
- 7527 Crossing Place
- 7557 Crossing Place
- 7575 Crossing Place
- 7515 Crossing Place
- 7548 Crossing Place
- 7562 Crossing Place
- 7501 Crossing Place
- 7595 Crossing Place
- 7578 Crossing Place
- 7504 Crossing Place
- 7590 Crossing Place
- 7611 Crossing Place
- 7481 Crossing Place
- 7606 Crossing Place
- 7486 Crossing Place
- 7623 Crossing Place
- 7618 Crossing Place
- 7465 Crossing Place
- 7474 Crossing Place
- 7641 Crossing Place