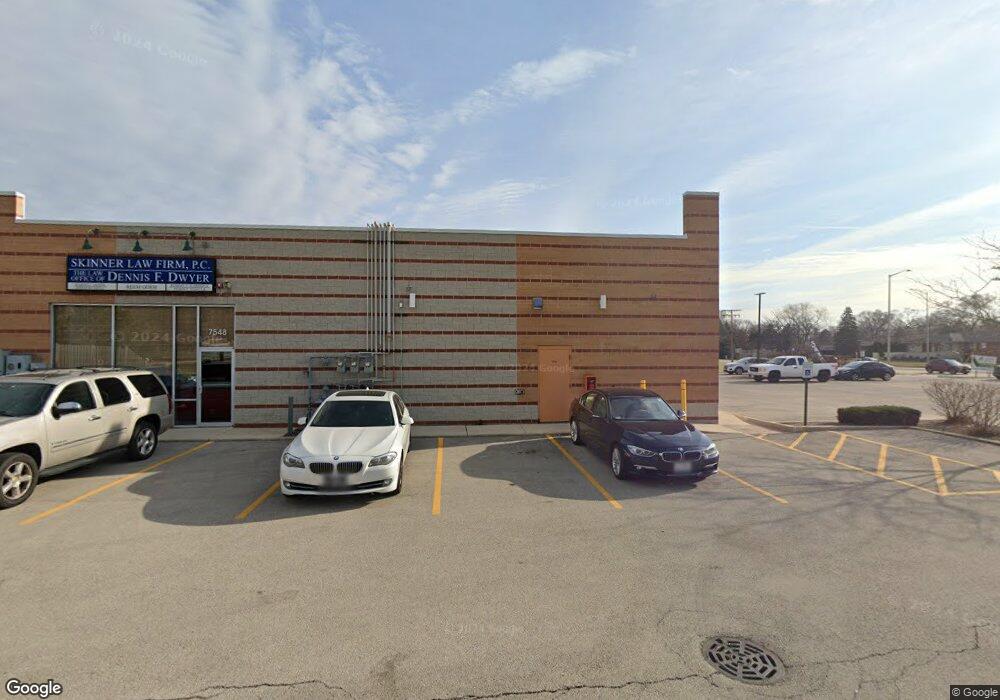
7544 103rd St Bridgeview, IL 60455
Estimated Value: $1,125,599
Studio
--
Bath
13,328
Sq Ft
$84/Sq Ft
Est. Value
About This Home
This home is located at 7544 103rd St, Bridgeview, IL 60455 and is currently estimated at $1,125,599, approximately $84 per square foot. 7544 103rd St is a home located in Cook County with nearby schools including Sorrick Elementary School, Oak Ridge Elementary School, and H H Conrady Jr High School.
Ownership History
Date
Name
Owned For
Owner Type
Purchase Details
Closed on
Nov 15, 2024
Sold by
Mufaddal Real Estate Fund Llc
Bought by
Bridgeview Holdings Llc
Current Estimated Value
Purchase Details
Closed on
Aug 18, 2018
Sold by
Aulad Llc
Bought by
Mufaddal Real Estate Fund Llc
Purchase Details
Closed on
Sep 5, 2014
Sold by
Jaidad Llc
Bought by
Aulad Llc
Home Financials for this Owner
Home Financials are based on the most recent Mortgage that was taken out on this home.
Original Mortgage
$783,000
Interest Rate
4.08%
Mortgage Type
Seller Take Back
Purchase Details
Closed on
Mar 13, 2009
Sold by
Court Plaza Of Bridgeview Llc
Bought by
Jaidad Llc
Home Financials for this Owner
Home Financials are based on the most recent Mortgage that was taken out on this home.
Original Mortgage
$1,000,000
Interest Rate
6.26%
Mortgage Type
Commercial
Create a Home Valuation Report for This Property
The Home Valuation Report is an in-depth analysis detailing your home's value as well as a comparison with similar homes in the area
Home Values in the Area
Average Home Value in this Area
Purchase History
| Date | Buyer | Sale Price | Title Company |
|---|---|---|---|
| Bridgeview Holdings Llc | -- | Lakeshore Title | |
| Bridgeview Holdings Llc | -- | Lakeshore Title | |
| Mufaddal Real Estate Fund Llc | $675,000 | Chicago Title | |
| Aulad Llc | $870,000 | Chicago Title Insurance Co | |
| Jaidad Llc | $3,300,000 | Cti |
Source: Public Records
Mortgage History
| Date | Status | Borrower | Loan Amount |
|---|---|---|---|
| Previous Owner | Aulad Llc | $783,000 | |
| Previous Owner | Jaidad Llc | $1,000,000 |
Source: Public Records
Tax History
| Year | Tax Paid | Tax Assessment Tax Assessment Total Assessment is a certain percentage of the fair market value that is determined by local assessors to be the total taxable value of land and additions on the property. | Land | Improvement |
|---|---|---|---|---|
| 2025 | $101,951 | $309,242 | $161,757 | $147,485 |
| 2024 | $101,951 | $309,242 | $161,757 | $147,485 |
| 2023 | $104,552 | $309,242 | $161,757 | $147,485 |
| 2022 | $104,552 | $258,347 | $161,757 | $96,590 |
| 2021 | $102,164 | $258,346 | $161,757 | $96,589 |
| 2020 | $92,356 | $237,715 | $161,757 | $75,958 |
| 2019 | $96,198 | $241,047 | $134,797 | $106,250 |
| 2018 | $65,793 | $168,750 | $134,797 | $33,953 |
| 2017 | $110,393 | $297,184 | $134,797 | $162,387 |
| 2016 | $109,567 | $273,888 | $121,317 | $152,571 |
| 2015 | $90,157 | $238,045 | $121,317 | $116,728 |
| 2014 | $87,665 | $238,045 | $121,317 | $116,728 |
| 2013 | $61,511 | $181,183 | $121,317 | $59,866 |
Source: Public Records
Map
Nearby Homes
- 10235 Mulberry Ln Unit D
- 10506 S Michael Dr
- 7912 W 105th St
- 10531 S Roberts Rd Unit 1-A
- 7826 W 98th Place
- 10226 S 81st Ave
- 10459 S 81st Ave
- 7240 W 107th St Unit 136
- 10516 Ridge Cove Dr Unit 36C
- 7048 Oconnell Dr Unit 3W
- 7100 99th St Unit 204
- 7110 W 107th St Unit 16
- 9832 Nottingham Ave Unit 17
- 9832 Nottingham Ave Unit 10
- 7102 W 107th St Unit 3F
- 9645 S 78th Ct
- 8103 W 98th St
- 9745 S 81st Ave
- 7008 Oconnell Dr Unit 201
- 8103 Gladys Ln
- 7544 W 103rd St
- 7540 103rd St
- 7524 W 103rd St
- 7520 103rd St
- 7515 Claridge Dr
- 7515 Claridge Dr Unit F
- 7515 Claridge Dr Unit E
- 7515 Claridge Dr Unit D
- 7515 Claridge Dr Unit C
- 7515 Claridge Dr Unit B
- 7515 Claridge Dr Unit A
- 10301 S Terry Dr
- 7524 Claridge Dr
- 7524 Claridge Dr Unit E
- 7524 Claridge Dr Unit J
- 7524 Claridge Dr Unit H
- 7524 Claridge Dr Unit L
- 7524 Claridge Dr Unit D
- 7524 Claridge Dr Unit A
- 7524 Claridge Dr Unit G
Your Personal Tour Guide
Ask me questions while you tour the home.