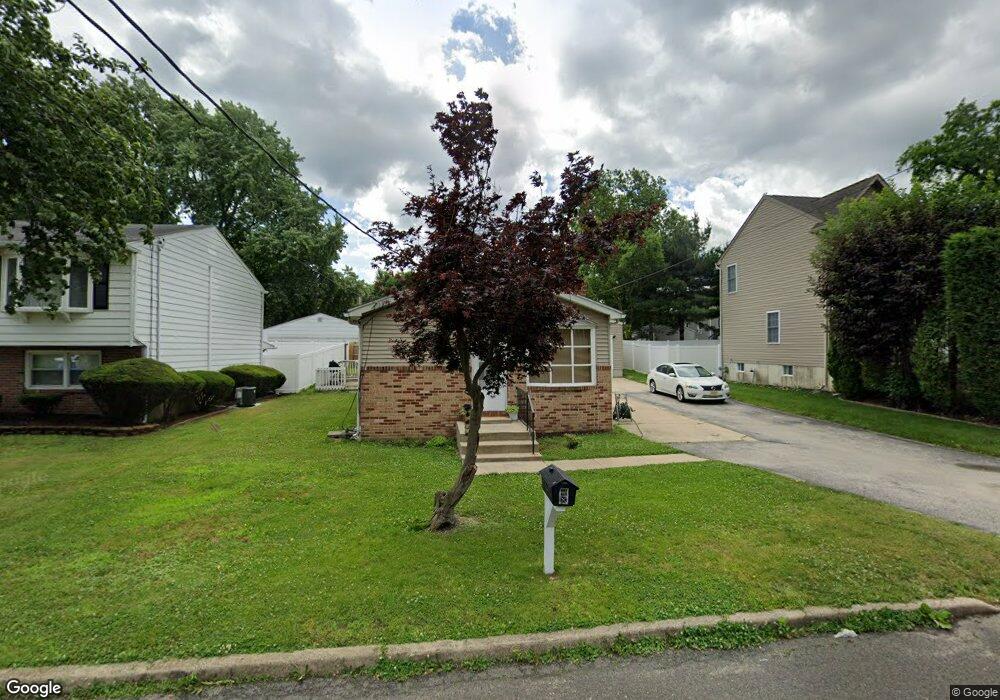
7544 Forrest Ave Pennsauken, NJ 08110
Estimated Value: $250,000 - $337,000
--
Bed
--
Bath
1,308
Sq Ft
$223/Sq Ft
Est. Value
About This Home
This home is located at 7544 Forrest Ave, Pennsauken, NJ 08110 and is currently estimated at $292,275, approximately $223 per square foot. 7544 Forrest Ave is a home located in Camden County with nearby schools including Pennsauken High School, Camdens Promise Charter School, and St. Cecilia School.
Ownership History
Date
Name
Owned For
Owner Type
Purchase Details
Closed on
Feb 24, 2022
Sold by
Guess Braden D
Bought by
Talley Beverly and Wanamaker Beverly
Current Estimated Value
Home Financials for this Owner
Home Financials are based on the most recent Mortgage that was taken out on this home.
Original Mortgage
$83,460
Outstanding Balance
$76,041
Interest Rate
3.92%
Mortgage Type
FHA
Estimated Equity
$216,234
Purchase Details
Closed on
Jul 26, 2000
Sold by
Fante Jeffrey A
Bought by
Guess Braden
Home Financials for this Owner
Home Financials are based on the most recent Mortgage that was taken out on this home.
Original Mortgage
$95,950
Interest Rate
8.21%
Purchase Details
Closed on
Jan 21, 1999
Sold by
Homecomings Financial Network
Bought by
Fante Jeffrey
Home Financials for this Owner
Home Financials are based on the most recent Mortgage that was taken out on this home.
Original Mortgage
$79,100
Interest Rate
6.74%
Create a Home Valuation Report for This Property
The Home Valuation Report is an in-depth analysis detailing your home's value as well as a comparison with similar homes in the area
Home Values in the Area
Average Home Value in this Area
Purchase History
| Date | Buyer | Sale Price | Title Company |
|---|---|---|---|
| Talley Beverly | $85,000 | Endurance Abstract | |
| Guess Braden | $101,000 | -- | |
| Fante Jeffrey | $52,500 | -- |
Source: Public Records
Mortgage History
| Date | Status | Borrower | Loan Amount |
|---|---|---|---|
| Open | Talley Beverly | $83,460 | |
| Previous Owner | Guess Braden | $95,950 | |
| Previous Owner | Fante Jeffrey | $79,100 |
Source: Public Records
Tax History Compared to Growth
Tax History
| Year | Tax Paid | Tax Assessment Tax Assessment Total Assessment is a certain percentage of the fair market value that is determined by local assessors to be the total taxable value of land and additions on the property. | Land | Improvement |
|---|---|---|---|---|
| 2025 | $5,505 | $306,000 | $51,600 | $254,400 |
| 2024 | $5,399 | $126,500 | $31,100 | $95,400 |
| 2023 | $5,399 | $126,500 | $31,100 | $95,400 |
| 2022 | $4,882 | $126,500 | $31,100 | $95,400 |
| 2021 | $4,776 | $126,500 | $31,100 | $95,400 |
| 2020 | $4,491 | $126,500 | $31,100 | $95,400 |
| 2019 | $4,543 | $126,500 | $31,100 | $95,400 |
| 2018 | $4,567 | $126,500 | $31,100 | $95,400 |
| 2017 | $4,576 | $126,500 | $31,100 | $95,400 |
| 2016 | $4,493 | $126,500 | $31,100 | $95,400 |
| 2015 | $4,627 | $126,500 | $31,100 | $95,400 |
| 2014 | $4,639 | $83,400 | $13,800 | $69,600 |
Source: Public Records
Map
Nearby Homes
- 1505 Velde Ave
- 7344 Forrest Ave
- 7527 Tripoli Ave
- 815 Delair Ave
- 555 Velde Ave
- 7924 River Rd
- 437 Velde Ave
- 8234 Eden Ln
- 8249 Eden Ln
- 8438 Haines Rd
- 7406 Jackson Ave
- 2410 Shelley Ln
- 2269 Marlon Ave
- 2117 Penn St
- 2117 Scovel Ave
- 2543 Burning Tree Rd
- 2657 Rockafellow Ave
- 7028 Collins Ave
- 2561 Burning Tree Rd
- 1506 Hollinshed Ave
- 7552 Forrest Ave
- 7538 Forrest Ave
- 7539 Boulevard Ave
- 7532 Forrest Ave
- 7549 Boulevard Ave
- 7560 Forrest Ave
- 7527 Boulevard Ave
- 7553 Boulevard Ave
- 7549 Forrest Ave
- 7543 Forrest Ave
- 7553 Forrest Ave
- 7528 Forrest Ave
- 7523 Boulevard Ave
- 7568 Forrest Ave
- 7565 Boulevard Ave
- 7515 Boulevard Ave
- 7563 Forrest Ave
- 7515 Forrest Ave
- 7574 Forrest Ave
- 7575 Boulevard Ave