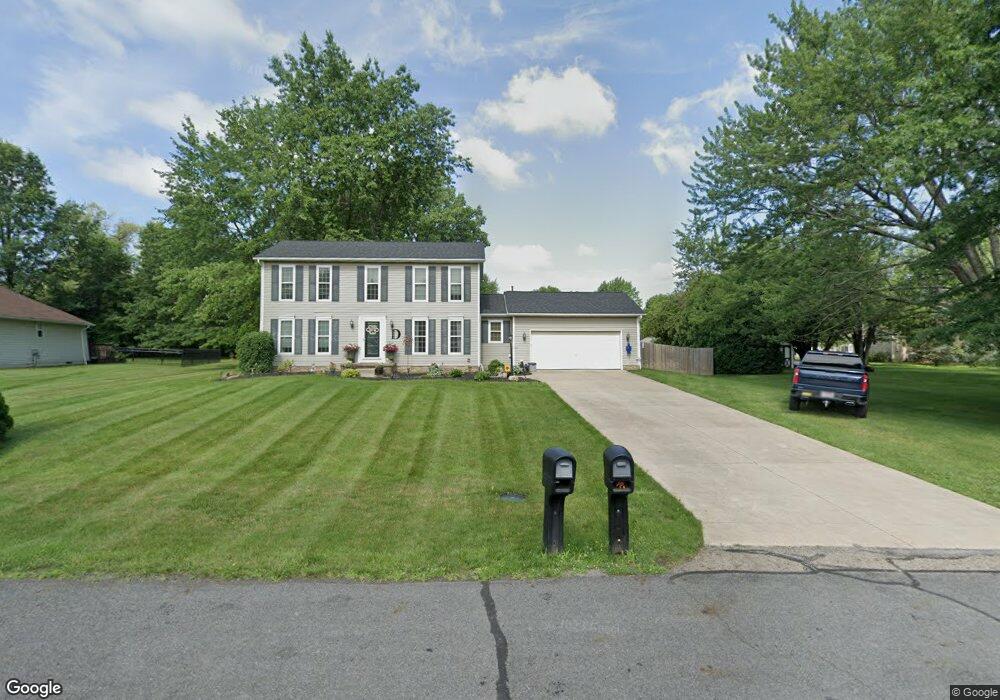
7544 Skyhaven Rd Northfield, OH 44067
Estimated Value: $346,000 - $420,000
3
Beds
3
Baths
1,848
Sq Ft
$199/Sq Ft
Est. Value
About This Home
This home is located at 7544 Skyhaven Rd, Northfield, OH 44067 and is currently estimated at $366,991, approximately $198 per square foot. 7544 Skyhaven Rd is a home located in Summit County with nearby schools including Lee Eaton Elementary School, Nordonia Middle School, and Nordonia High School.
Ownership History
Date
Name
Owned For
Owner Type
Purchase Details
Closed on
Oct 16, 2012
Sold by
Dalrymple Robert and Dalrymple Michle
Bought by
Dalrymple Robert and Crane Dalrymple Michele
Current Estimated Value
Home Financials for this Owner
Home Financials are based on the most recent Mortgage that was taken out on this home.
Original Mortgage
$183,353
Outstanding Balance
$126,906
Interest Rate
3.5%
Mortgage Type
FHA
Estimated Equity
$240,085
Purchase Details
Closed on
Sep 30, 2008
Sold by
Citimortgage Inc
Bought by
Dalrymple Robert and Dalrymple Michele
Home Financials for this Owner
Home Financials are based on the most recent Mortgage that was taken out on this home.
Original Mortgage
$148,144
Interest Rate
6.11%
Mortgage Type
FHA
Purchase Details
Closed on
Sep 18, 2006
Sold by
Rist Randall W
Bought by
Citifinancial Mortgage Co Inc
Create a Home Valuation Report for This Property
The Home Valuation Report is an in-depth analysis detailing your home's value as well as a comparison with similar homes in the area
Home Values in the Area
Average Home Value in this Area
Purchase History
| Date | Buyer | Sale Price | Title Company |
|---|---|---|---|
| Dalrymple Robert | -- | None Available | |
| Dalrymple Robert | $150,100 | Chicago Title | |
| Citifinancial Mortgage Co Inc | $199,900 | None Available |
Source: Public Records
Mortgage History
| Date | Status | Borrower | Loan Amount |
|---|---|---|---|
| Open | Dalrymple Robert | $183,353 | |
| Closed | Dalrymple Robert | $148,144 |
Source: Public Records
Tax History Compared to Growth
Tax History
| Year | Tax Paid | Tax Assessment Tax Assessment Total Assessment is a certain percentage of the fair market value that is determined by local assessors to be the total taxable value of land and additions on the property. | Land | Improvement |
|---|---|---|---|---|
| 2025 | $5,547 | $108,298 | $19,079 | $89,219 |
| 2024 | $5,547 | $108,298 | $19,079 | $89,219 |
| 2023 | $5,547 | $108,298 | $19,079 | $89,219 |
| 2022 | $4,828 | $78,306 | $13,727 | $64,579 |
| 2021 | $4,842 | $78,306 | $13,727 | $64,579 |
| 2020 | $4,396 | $72,180 | $13,730 | $58,450 |
| 2019 | $5,047 | $75,100 | $12,900 | $62,200 |
| 2018 | $4,448 | $75,100 | $12,900 | $62,200 |
| 2017 | $3,682 | $75,100 | $12,900 | $62,200 |
| 2016 | $3,665 | $58,930 | $12,900 | $46,030 |
| 2015 | $3,682 | $58,930 | $12,900 | $46,030 |
| 2014 | $3,660 | $58,930 | $12,900 | $46,030 |
| 2013 | $3,513 | $59,990 | $12,900 | $47,090 |
Source: Public Records
Map
Nearby Homes
- 0 E Oakmont Way
- 41 Hazel Dr
- 26 Woodbury Ln Unit 44
- 100 Hazel Dr
- 42 Woodbury Ln
- 8505 Olde 8 Rd
- 0 Capital Blvd
- 161 Marwyck Place Ln Unit 33
- 7840 Shady Ln
- 285 Skylane Dr
- 8051 Wren Dr
- 8961 Lowell Ln
- 553 Brookline Ct
- 7739 Olde Eight Rd
- 677 Rolling Brooke Way
- 0 Highland Valley View Rd E
- 697 Brookledge Ct
- 1051 Riviera Way
- 8282 Fairlane Dr
- 1143 Meadow Woods Dr
- 7534 Skyhaven Rd
- 169 N Oakmont Dr
- 155 N Oakmont Dr
- 139 N Oakmont Dr
- 7526 Skyhaven Rd
- 89 N Oakmont Dr
- 121 N Oakmont Dr
- 7545 Skyhaven Rd
- 189 N Oakmont Dr
- 7531 Skyhaven Rd
- 79 N Oakmont Dr
- 7518 Skyhaven Rd
- 69 N Oakmont Dr
- 199 N Oakmont Dr
- 154 N Oakmont Dr
- 7510 Skyhaven Rd
- 176 N Oakmont Dr
- 144 N Oakmont Dr
- 7515 Skyhaven Rd
- 134 N Oakmont Dr