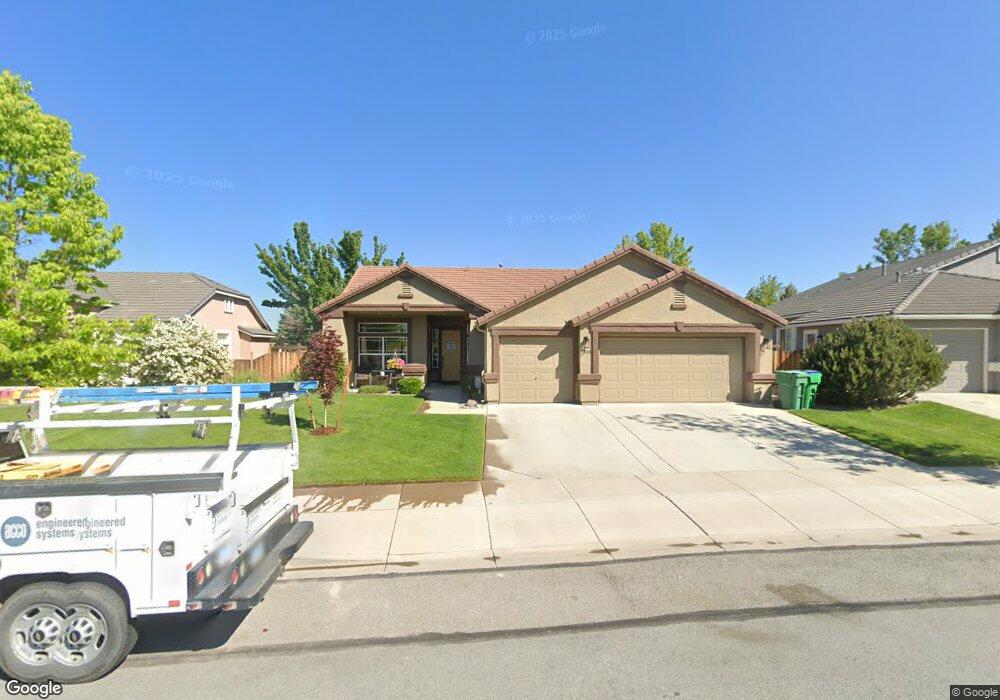
7545 Bareback Dr Sparks, NV 89436
Wingfield Springs NeighborhoodEstimated Value: $581,190 - $596,000
3
Beds
2
Baths
1,775
Sq Ft
$332/Sq Ft
Est. Value
About This Home
This home is located at 7545 Bareback Dr, Sparks, NV 89436 and is currently estimated at $588,548, approximately $331 per square foot. 7545 Bareback Dr is a home located in Washoe County with nearby schools including Spanish Springs Elementary School, Yvonne Shaw Middle School, and Spanish Springs High School.
Ownership History
Date
Name
Owned For
Owner Type
Purchase Details
Closed on
Sep 6, 2006
Sold by
Taylor Dedrique
Bought by
Harrison Kenneth and Harrison Lori
Current Estimated Value
Home Financials for this Owner
Home Financials are based on the most recent Mortgage that was taken out on this home.
Original Mortgage
$354,050
Outstanding Balance
$198,457
Interest Rate
5.75%
Mortgage Type
Unknown
Estimated Equity
$390,091
Purchase Details
Closed on
Dec 1, 2004
Sold by
Reynen & Bardis The Foothills Llc
Bought by
Taylor Dedrique L
Home Financials for this Owner
Home Financials are based on the most recent Mortgage that was taken out on this home.
Original Mortgage
$235,947
Interest Rate
7.35%
Mortgage Type
Unknown
Create a Home Valuation Report for This Property
The Home Valuation Report is an in-depth analysis detailing your home's value as well as a comparison with similar homes in the area
Home Values in the Area
Average Home Value in this Area
Purchase History
| Date | Buyer | Sale Price | Title Company |
|---|---|---|---|
| Harrison Kenneth | $365,000 | First Centennial Title Co | |
| Taylor Dedrique L | $262,500 | First American Title |
Source: Public Records
Mortgage History
| Date | Status | Borrower | Loan Amount |
|---|---|---|---|
| Open | Harrison Kenneth | $354,050 | |
| Previous Owner | Taylor Dedrique L | $235,947 |
Source: Public Records
Tax History
| Year | Tax Paid | Tax Assessment Tax Assessment Total Assessment is a certain percentage of the fair market value that is determined by local assessors to be the total taxable value of land and additions on the property. | Land | Improvement |
|---|---|---|---|---|
| 2026 | $2,849 | $155,281 | $44,065 | $111,216 |
| 2025 | $3,144 | $141,186 | $43,925 | $97,261 |
| 2024 | $3,144 | $135,843 | $37,940 | $97,903 |
| 2023 | $3,055 | $135,651 | $43,295 | $92,356 |
| 2022 | $2,965 | $112,406 | $35,490 | $76,916 |
| 2021 | $2,748 | $104,870 | $28,350 | $76,520 |
| 2020 | $2,584 | $104,398 | $27,860 | $76,538 |
| 2019 | $2,462 | $101,193 | $27,615 | $73,578 |
| 2018 | $2,350 | $92,460 | $20,545 | $71,915 |
| 2017 | $2,256 | $90,941 | $18,935 | $72,006 |
| 2016 | $2,198 | $86,606 | $17,185 | $69,421 |
| 2015 | $2,195 | $81,148 | $17,150 | $63,998 |
| 2014 | $2,126 | $66,708 | $13,265 | $53,443 |
| 2013 | -- | $56,756 | $10,780 | $45,976 |
Source: Public Records
Map
Nearby Homes
- 7483 Europa Dr
- 7423 Comet Ct
- 7354 Phoenix Dr
- 7717 Sonic Ct
- 7337 Phoenix Dr
- 8495 Eaglenest Rd
- 7707 Rhythm Cir
- 7657 Bareback Dr
- 7220 Windswept Loop
- 3716 Early Dawn Dr
- 7214 Windswept Loop
- 8570 Eaglenest Rd
- 7260 Treeline Ct
- 7663 La Ramba Dr
- 7074 Cinder Village Dr
- 3245 Gerona Ct
- 7058 Cinder Village Dr
- 3760 Zoroaster Ct
- 3461 Tavira Ct
- 7045 Krug Dr
- 7555 Bareback Dr
- 7535 Bareback Dr
- 7525 Bareback Dr
- 7550 Bareback Dr
- 3783 Ulysses Ct
- 7515 Bareback Dr
- 7560 Bareback Dr
- 3773 Ulysses Ct
- 7570 Bareback Dr
- 7505 Bareback Dr
- 3763 Ulysses Ct
- 3784 Ulysses Ct
- 3753 Ulysses Ct
- 3753 Ulysses Ct Unit Suite 103
- 7580 Bareback Dr
- 3774 Ulysses Ct
- 3764 Ulysses Ct
- 3743 Ulysses Ct
- 3902 Wisdom Dr
- 3888 Wisdom Dr
Your Personal Tour Guide
Ask me questions while you tour the home.