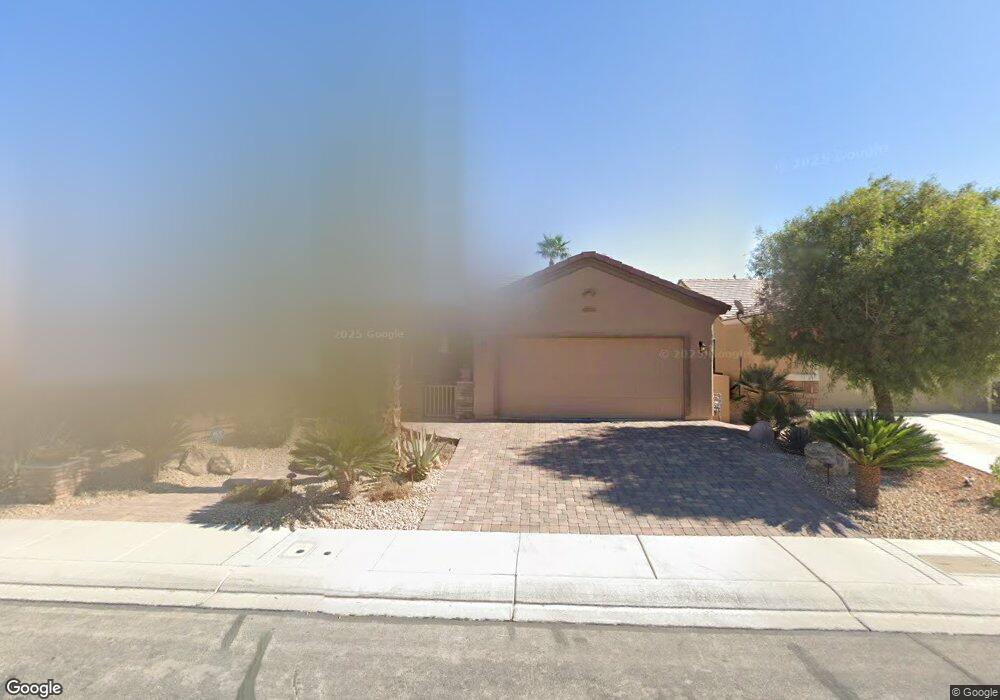
7548 Chaffinch St North Las Vegas, NV 89084
Aliante NeighborhoodEstimated Value: $403,478 - $411,000
2
Beds
2
Baths
1,570
Sq Ft
$260/Sq Ft
Est. Value
About This Home
This home is located at 7548 Chaffinch St, North Las Vegas, NV 89084 and is currently estimated at $407,620, approximately $259 per square foot. 7548 Chaffinch St is a home located in Clark County with nearby schools including Vincent L. Triggs Elementary School, Anthony Saville Middle School, and Shadow Ridge High School.
Ownership History
Date
Name
Owned For
Owner Type
Purchase Details
Closed on
Mar 16, 2024
Sold by
Napolitano Family Trust
Bought by
Napolitano Family Trust and Napolitano
Current Estimated Value
Home Financials for this Owner
Home Financials are based on the most recent Mortgage that was taken out on this home.
Original Mortgage
$622,500
Outstanding Balance
$489,758
Interest Rate
3.1%
Mortgage Type
Reverse Mortgage Home Equity Conversion Mortgage
Estimated Equity
-$82,138
Purchase Details
Closed on
Aug 30, 2016
Sold by
Napolitano Joseph A and Napolitano Georgiana S
Bought by
Napolitano Joseph A and Napolitano Gerogiana
Purchase Details
Closed on
Oct 19, 2007
Sold by
Pn Ii Inc
Bought by
Napolitano Joseph A and Napolitano Georgiana S
Home Financials for this Owner
Home Financials are based on the most recent Mortgage that was taken out on this home.
Original Mortgage
$167,965
Interest Rate
6.27%
Mortgage Type
Unknown
Purchase Details
Closed on
Dec 1, 2006
Sold by
North Valley Enterprises Llc
Bought by
Pn Ii Inc
Create a Home Valuation Report for This Property
The Home Valuation Report is an in-depth analysis detailing your home's value as well as a comparison with similar homes in the area
Home Values in the Area
Average Home Value in this Area
Purchase History
| Date | Buyer | Sale Price | Title Company |
|---|---|---|---|
| Napolitano Family Trust | -- | Equity Title | |
| Napolitano Joseph A | -- | None Available | |
| Napolitano Joseph A | $252,965 | Lawyers Title Of Nevada | |
| Pn Ii Inc | $2,230,940 | First Amer Title Co Of Nv |
Source: Public Records
Mortgage History
| Date | Status | Borrower | Loan Amount |
|---|---|---|---|
| Open | Napolitano Family Trust | $622,500 | |
| Closed | Napolitano Family Trust | $622,500 | |
| Previous Owner | Napolitano Joseph A | $167,965 |
Source: Public Records
Tax History Compared to Growth
Tax History
| Year | Tax Paid | Tax Assessment Tax Assessment Total Assessment is a certain percentage of the fair market value that is determined by local assessors to be the total taxable value of land and additions on the property. | Land | Improvement |
|---|---|---|---|---|
| 2025 | $2,224 | $107,052 | $29,400 | $77,652 |
| 2024 | $2,160 | $107,052 | $29,400 | $77,652 |
| 2023 | $1,759 | $104,796 | $31,605 | $73,191 |
| 2022 | $2,097 | $93,880 | $27,195 | $66,685 |
| 2021 | $2,036 | $87,470 | $24,255 | $63,215 |
| 2020 | $1,970 | $85,790 | $23,520 | $62,270 |
| 2019 | $1,913 | $82,635 | $21,315 | $61,320 |
| 2018 | $1,857 | $75,887 | $16,905 | $58,982 |
| 2017 | $2,517 | $74,164 | $15,400 | $58,764 |
| 2016 | $1,759 | $72,226 | $13,475 | $58,751 |
| 2015 | $1,755 | $58,231 | $10,780 | $47,451 |
| 2014 | $1,703 | $48,461 | $7,700 | $40,761 |
Source: Public Records
Map
Nearby Homes
- 7543 Marie Brook Ln
- 7831 Nestor Creek Ln
- 7509 Chaffinch St
- 7460 Chaffinch St
- 7511 Phoenix Falls St
- 7556 Wingspread St
- 7716 Homing Pigeon St
- 1943 Marks River Place
- 7751 Widewing Dr
- 2508 Mourning Warbler Ave
- 7773 Wading Bird Way
- 7737 Nestor Creek Ln
- 7757 Coast Jay St
- 7531 Bryan Harbor Ln
- 7465 Widewing Dr
- 7817 Homing Pigeon St
- 7605 Moore Creek Ln
- 7464 Chipping Sparrow St
- 7817 Starthroat Ct Unit 8
- 7824 Starthroat Ct
- 7544 Chaffinch St
- 2113 Geese Ave
- 2117 Geese Ave
- 2109 Geese Ave
- 7540 Chaffinch St
- 2105 Geese Ave
- 7541 Homing Pigeon St
- 7545 Homing Pigeon St
- 7553 Chaffinch St
- 7553 Chaffinch St
- 7536 Chaffinch St
- 7537 Homing Pigeon St
- 7557 Chaffinch St
- 7549 Chaffinch St
- 2021 Geese Ave
- 7545 Chaffinch St
- 7605 Chaffinch St
- 7541 Chaffinch St
- 7609 Chaffinch St
- 7616 Chaffinch St