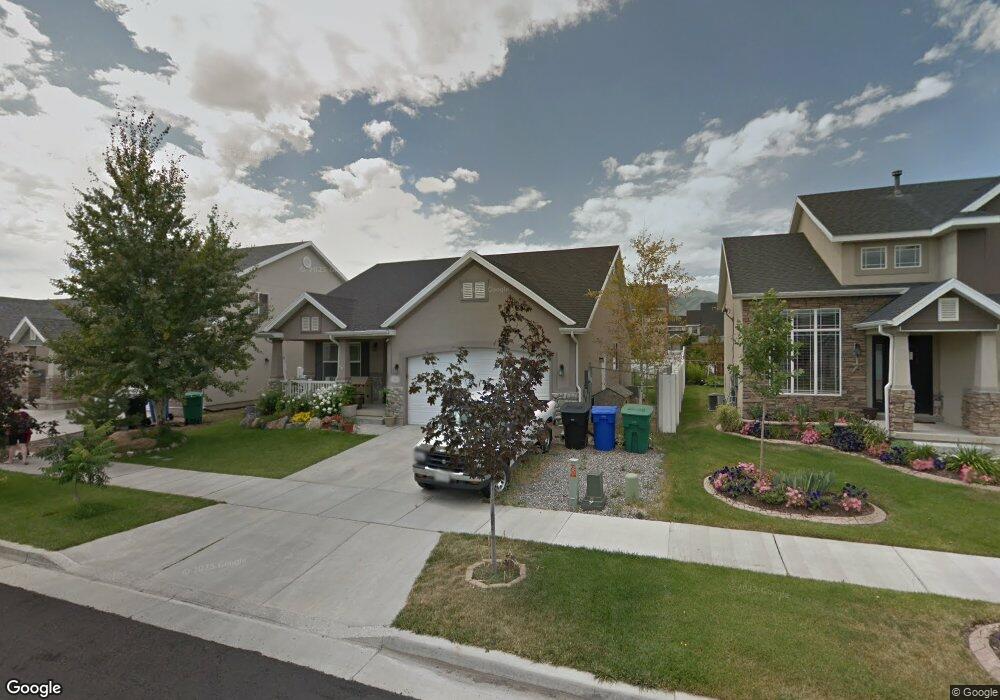
7548 Mesa Maple Dr West Jordan, UT 84081
Jordan Hills NeighborhoodEstimated Value: $539,000 - $572,000
About This Home
Please note, our homes are available on a first-come, first-serve basis and are not reserved until the lease is signed by all applicants and security deposits are collected.
This home features Progress Smart Home - Progress Residential's smart home app, which allows you to control the home securely from any of your devices. Learn more at
Rent this home by July 31, 2025 and receive $1000.
Want to tour on your own? Click the “Self Tour” button on this home’s listing or call to register for a self-guided showing at a time that works best for you.
Interested in this home? You clearly have exceptional taste. Like all our homes, this one features: a great location in a desirable neighborhood, a comfortable layout with good-sized bedrooms and bathrooms, a great kitchen with plenty of counter and cabinet space, many updated and upgraded features, central HVAC and programmable thermostat, garage and a spacious yard, and it's pet friendly. Call or click to schedule a tour or submit your application online at today!
At Progress Residential® we're here to serve you and make your time in the home as convenient as possible. We offer: a safe and secure online portal where you can place maintenance requests and pay online, multiple payment options, 24/7 Emergency maintenance response team available even on weekends, and well-maintained homes with regular preventative maintenance.
Ownership History
Purchase Details
Home Financials for this Owner
Home Financials are based on the most recent Mortgage that was taken out on this home.Purchase Details
Purchase Details
Home Financials for this Owner
Home Financials are based on the most recent Mortgage that was taken out on this home.Purchase Details
Purchase Details
Purchase Details
Home Financials for this Owner
Home Financials are based on the most recent Mortgage that was taken out on this home.Home Values in the Area
Average Home Value in this Area
Purchase History
| Date | Buyer | Sale Price | Title Company |
|---|---|---|---|
| Olympus Borrower 1 Llc | -- | Servicelink | |
| Olympus Borrower Llc | -- | First Integrity Ttl Agcy Llc | |
| Collegiate Holdings Llc | -- | Accommodation | |
| Anderson Christopher D | -- | Meridian Title | |
| Collegiate Holdings Llc | -- | Accommodation | |
| 33 Holdings Llc | $191,251 | Accommodation | |
| Quarnberg Justin C | -- | Provo Land Title Company |
Mortgage History
| Date | Status | Borrower | Loan Amount |
|---|---|---|---|
| Open | Olympus Borrower 1 Llc | $467,170,000 | |
| Previous Owner | Anderson Christopher D | $171,500 | |
| Previous Owner | Quarnberg Justin C | $159,939 |
Property History
| Date | Event | Price | List to Sale | Price per Sq Ft |
|---|---|---|---|---|
| 08/03/2025 08/03/25 | Off Market | $2,815 | -- | -- |
| 07/22/2025 07/22/25 | Price Changed | $2,815 | -1.9% | $1 / Sq Ft |
| 07/08/2025 07/08/25 | Price Changed | $2,870 | -1.0% | $1 / Sq Ft |
| 07/01/2025 07/01/25 | Price Changed | $2,900 | -1.9% | $1 / Sq Ft |
| 06/29/2025 06/29/25 | Price Changed | $2,955 | -1.3% | $1 / Sq Ft |
| 06/24/2025 06/24/25 | Price Changed | $2,995 | -3.1% | $1 / Sq Ft |
| 06/17/2025 06/17/25 | Price Changed | $3,090 | -2.4% | $1 / Sq Ft |
| 06/16/2025 06/16/25 | Price Changed | $3,165 | -0.5% | $1 / Sq Ft |
| 06/12/2025 06/12/25 | Price Changed | $3,180 | -0.2% | $1 / Sq Ft |
| 06/05/2025 06/05/25 | Price Changed | $3,185 | -0.2% | $1 / Sq Ft |
| 06/04/2025 06/04/25 | Price Changed | $3,190 | -0.9% | $1 / Sq Ft |
| 05/31/2025 05/31/25 | Price Changed | $3,220 | -1.1% | $1 / Sq Ft |
| 05/25/2025 05/25/25 | Price Changed | $3,255 | -0.9% | $1 / Sq Ft |
| 05/22/2025 05/22/25 | Price Changed | $3,285 | +6.1% | $1 / Sq Ft |
| 05/13/2025 05/13/25 | Price Changed | $3,095 | -1.9% | $1 / Sq Ft |
| 05/08/2025 05/08/25 | Price Changed | $3,155 | -0.6% | $1 / Sq Ft |
| 05/07/2025 05/07/25 | Price Changed | $3,175 | -1.4% | $1 / Sq Ft |
| 05/06/2025 05/06/25 | Price Changed | $3,220 | +0.2% | $1 / Sq Ft |
| 05/05/2025 05/05/25 | Price Changed | $3,215 | -0.3% | $1 / Sq Ft |
| 05/03/2025 05/03/25 | Price Changed | $3,225 | -0.9% | $1 / Sq Ft |
| 05/01/2025 05/01/25 | Price Changed | $3,255 | +1.1% | $1 / Sq Ft |
| 04/28/2025 04/28/25 | Price Changed | $3,220 | -0.5% | $1 / Sq Ft |
| 04/27/2025 04/27/25 | Price Changed | $3,235 | +0.2% | $1 / Sq Ft |
| 04/26/2025 04/26/25 | Price Changed | $3,230 | -0.2% | $1 / Sq Ft |
| 04/24/2025 04/24/25 | Price Changed | $3,235 | +0.2% | $1 / Sq Ft |
| 04/23/2025 04/23/25 | Price Changed | $3,230 | -0.9% | $1 / Sq Ft |
| 04/22/2025 04/22/25 | Price Changed | $3,260 | -0.8% | $1 / Sq Ft |
| 04/12/2025 04/12/25 | Price Changed | $3,285 | -0.2% | $1 / Sq Ft |
| 04/11/2025 04/11/25 | Price Changed | $3,290 | -0.2% | $1 / Sq Ft |
| 04/10/2025 04/10/25 | Price Changed | $3,295 | +0.2% | $1 / Sq Ft |
| 04/08/2025 04/08/25 | Price Changed | $3,290 | +0.2% | $1 / Sq Ft |
| 04/06/2025 04/06/25 | Price Changed | $3,285 | -0.8% | $1 / Sq Ft |
| 04/03/2025 04/03/25 | Price Changed | $3,310 | -0.2% | $1 / Sq Ft |
| 04/02/2025 04/02/25 | Price Changed | $3,315 | -0.2% | $1 / Sq Ft |
| 04/01/2025 04/01/25 | Price Changed | $3,320 | +1.1% | $1 / Sq Ft |
| 03/31/2025 03/31/25 | Price Changed | $3,285 | -0.6% | $1 / Sq Ft |
| 03/28/2025 03/28/25 | Price Changed | $3,305 | -0.2% | $1 / Sq Ft |
| 03/26/2025 03/26/25 | Price Changed | $3,310 | +0.2% | $1 / Sq Ft |
| 03/25/2025 03/25/25 | Price Changed | $3,305 | +0.2% | $1 / Sq Ft |
| 03/25/2025 03/25/25 | For Rent | $3,300 | -- | -- |
Tax History Compared to Growth
Tax History
| Year | Tax Paid | Tax Assessment Tax Assessment Total Assessment is a certain percentage of the fair market value that is determined by local assessors to be the total taxable value of land and additions on the property. | Land | Improvement |
|---|---|---|---|---|
| 2025 | $2,802 | $518,500 | $123,800 | $394,700 |
| 2024 | $2,802 | $493,400 | $119,000 | $374,400 |
| 2023 | $2,802 | $467,400 | $114,500 | $352,900 |
| 2022 | $2,947 | $484,800 | $112,300 | $372,500 |
| 2021 | $2,399 | $365,100 | $86,400 | $278,700 |
| 2020 | $2,236 | $318,400 | $80,100 | $238,300 |
| 2019 | $2,195 | $306,100 | $75,600 | $230,500 |
| 2018 | $2,047 | $282,400 | $75,600 | $206,800 |
| 2017 | $1,952 | $266,400 | $75,600 | $190,800 |
| 2016 | $2,021 | $259,300 | $69,900 | $189,400 |
| 2015 | $1,672 | $207,800 | $75,200 | $132,600 |
| 2014 | $1,633 | $199,500 | $72,900 | $126,600 |
Map
- 6777 Grevillea Ln
- 7474 S Sunset Maple Dr
- 6463 W Maple Valley Cir Unit 1030
- 6412 W Chan Reese Dr
- 6793 Tupelo Ln
- 7613 Oak Hallow Rd Unit 325
- 6934 Pointe Cedar Ln Unit 330
- 6938 Pointe Cedar Ln Unit 331
- 6593 W 7870 S
- 6602 W Braeburn Way
- Accord Plan at Orchard Heights
- Interlude Plan at Orchard Heights
- Octave Plan at Orchard Heights
- Treble Plan at Orchard Heights
- Princeton Plan at Orchard Heights
- Adagio Plan at Orchard Heights
- Forte Plan at Orchard Heights
- Tempo Plan at Orchard Heights
- Concerto Plan at Orchard Heights
- Rhapsody Plan at Orchard Heights
- 7548 S Mesa Maple Dr
- 7538 Mesa Maple Dr
- 7538 Mesa Maple Dr Unit 395
- 7538 S Mesa Maple Dr
- 7558 Mesa Maple Dr
- 7558 Mesa Maple Dr Unit 397
- 7558 S Mesa Maple Dr
- 7549 S 6670 W
- 7532 S Mesa Maple Dr
- 7532 Mesa Maple Dr
- 7564 S Mesa Maple Dr
- 7564 Mesa Maple Dr
- 7539 S 6670 W
- 7557 S 6670 W
- 7531 S 6670 W
- 7563 S 6670 W
- 7547 Mesa Maple Dr
- 7524 S Mesa Maple Dr
- 7524 Mesa Maple Dr
- 7557 Mesa Maple Dr