T
Seller's Agent in 2025
TRENT STEMPEK
EXP REALTY, INC.
(402) 276-3426
67 Total Sales
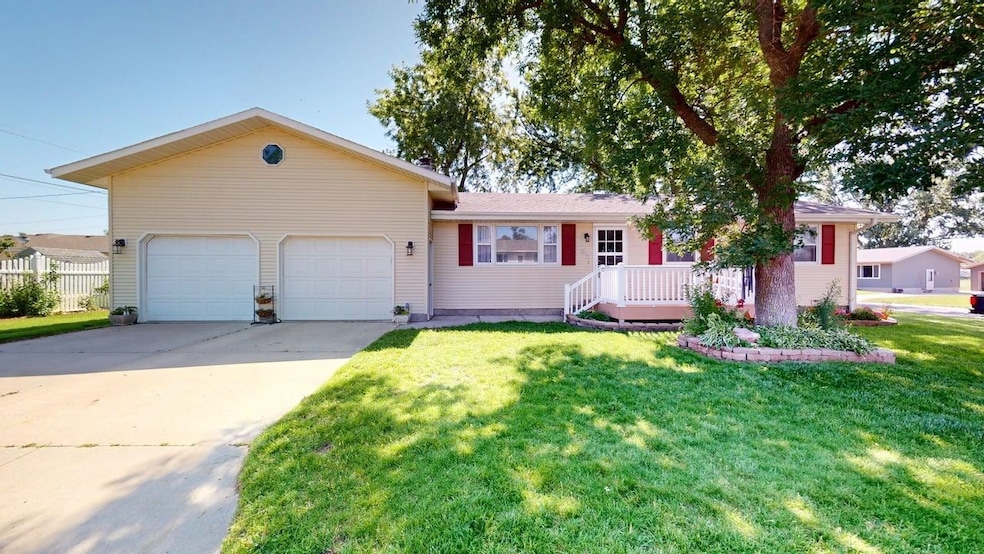
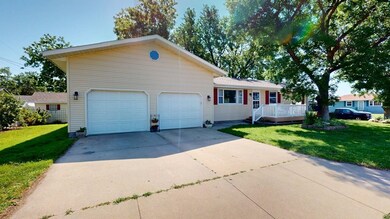
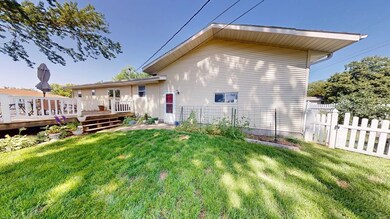
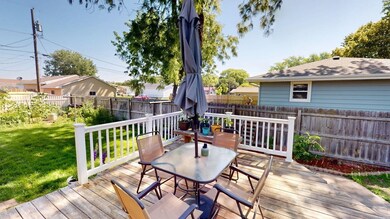


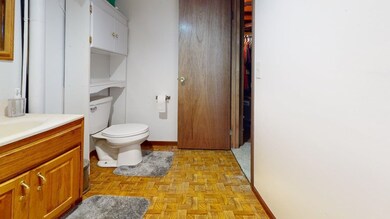
Great house with tons of curb appeal! Plenty of established flowers and a mini orchard also! 4 dwarf Honeycrisp Apple Trees, 2 dwarf Cherry Trees, 1 Peach Tree, 2 Blueberry Bushes, and a Blackberry Bush. Plenty of garden space and a good-sized yard. 3 bedrooms with 1 extra in basement. 2 car Heated garage with lots of storage above. Brand New carpet in basement. Large deck Great for entertaining and relaxing. Underground sprinklers. Wood fireplace. Move in ready with amazing neighbors.
Last Agent to Sell the Property
EXP REALTY, INC. License #20000503 Listed on: 06/20/2025

| Date | Type | Sale Price | Title Company |
|---|---|---|---|
| Warranty Deed | $210,000 | 10 County Title | |
| Quit Claim Deed | -- | 10 County Title | |
| Warranty Deed | $144,000 | Platte County Title & Escrow |
| Date | Status | Loan Amount | Loan Type |
|---|---|---|---|
| Previous Owner | $106,500 | New Conventional |
| Date | Event | Price | List to Sale | Price per Sq Ft |
|---|---|---|---|---|
| 12/12/2025 12/12/25 | Sold | $210,000 | -16.0% | $192 / Sq Ft |
| 10/29/2025 10/29/25 | Pending | -- | -- | -- |
| 07/08/2025 07/08/25 | Price Changed | $249,900 | -3.8% | $229 / Sq Ft |
| 07/01/2025 07/01/25 | Price Changed | $259,900 | -3.7% | $238 / Sq Ft |
| 06/20/2025 06/20/25 | For Sale | $270,000 | -- | $247 / Sq Ft |
| Year | Tax Paid | Tax Assessment Tax Assessment Total Assessment is a certain percentage of the fair market value that is determined by local assessors to be the total taxable value of land and additions on the property. | Land | Improvement |
|---|---|---|---|---|
| 2025 | $2,345 | $205,530 | $6,750 | $198,780 |
| 2024 | $2,928 | $198,850 | $3,375 | $195,475 |
| 2023 | $2,928 | $190,150 | $3,375 | $186,775 |
| 2022 | $2,703 | $168,925 | $3,375 | $165,550 |
| 2021 | $2,597 | $162,050 | $3,375 | $158,675 |
| 2020 | $2,503 | $151,095 | $3,375 | $147,720 |
| 2019 | $2,091 | $126,335 | $3,375 | $122,960 |
| 2018 | $1,982 | $114,465 | $3,375 | $111,090 |
| 2017 | $1,971 | $114,465 | $3,375 | $111,090 |
| 2016 | $1,878 | $109,060 | $3,375 | $105,685 |
| 2015 | $1,902 | $109,060 | $3,375 | $105,685 |
| 2014 | $1,811 | $101,260 | $3,375 | $97,885 |
| 2012 | -- | $80,670 | $3,375 | $77,295 |
T
Seller's Agent in 2025
TRENT STEMPEK
EXP REALTY, INC.
(402) 276-3426
67 Total Sales
Source: Columbus Board of REALTORS® (NE)
MLS Number: 20250387
APN: 710014924
Ask me questions while you tour the home.