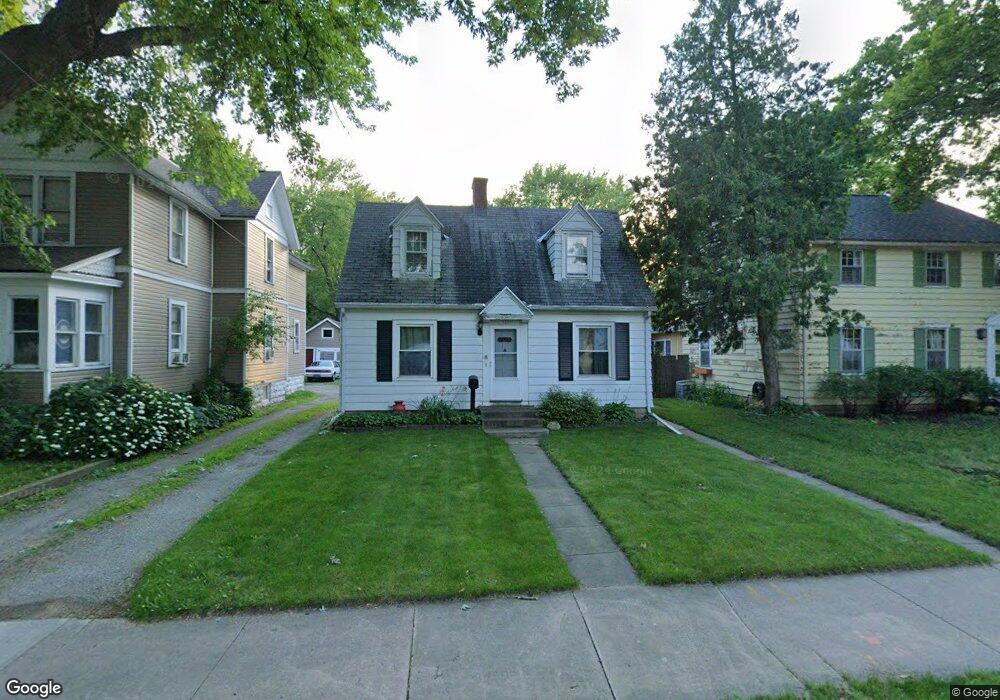
755 Bowen St Oshkosh, WI 54901
Menominee North NeighborhoodEstimated Value: $155,000 - $186,821
2
Beds
1
Bath
950
Sq Ft
$184/Sq Ft
Est. Value
About This Home
This home is located at 755 Bowen St, Oshkosh, WI 54901 and is currently estimated at $175,274, approximately $184 per square foot. 755 Bowen St is a home located in Winnebago County with nearby schools including Webster Stanley Elementary School, North High School, and St Frances Cabrini Elementary School.
Ownership History
Date
Name
Owned For
Owner Type
Purchase Details
Closed on
Jun 26, 2013
Sold by
Biwer Craig J
Bought by
Sorensen Kimberly A
Current Estimated Value
Home Financials for this Owner
Home Financials are based on the most recent Mortgage that was taken out on this home.
Original Mortgage
$73,000
Outstanding Balance
$52,879
Interest Rate
3.83%
Mortgage Type
New Conventional
Estimated Equity
$122,395
Create a Home Valuation Report for This Property
The Home Valuation Report is an in-depth analysis detailing your home's value as well as a comparison with similar homes in the area
Home Values in the Area
Average Home Value in this Area
Purchase History
| Date | Buyer | Sale Price | Title Company |
|---|---|---|---|
| Sorensen Kimberly A | -- | Home Title |
Source: Public Records
Mortgage History
| Date | Status | Borrower | Loan Amount |
|---|---|---|---|
| Open | Sorensen Kimberly A | $73,000 |
Source: Public Records
Tax History Compared to Growth
Tax History
| Year | Tax Paid | Tax Assessment Tax Assessment Total Assessment is a certain percentage of the fair market value that is determined by local assessors to be the total taxable value of land and additions on the property. | Land | Improvement |
|---|---|---|---|---|
| 2024 | $3,649 | $170,400 | $21,900 | $148,500 |
| 2023 | $3,087 | $93,400 | $12,900 | $80,500 |
| 2022 | $3,095 | $93,400 | $12,900 | $80,500 |
| 2021 | $2,275 | $93,400 | $12,900 | $80,500 |
| 2020 | $2,822 | $93,400 | $12,900 | $80,500 |
| 2019 | $2,745 | $93,400 | $12,900 | $80,500 |
| 2018 | $2,682 | $93,400 | $12,900 | $80,500 |
| 2017 | $2,465 | $93,400 | $12,900 | $80,500 |
| 2016 | $2,283 | $95,400 | $12,900 | $82,500 |
| 2015 | $2,275 | $95,400 | $12,900 | $82,500 |
| 2014 | $2,282 | $95,400 | $12,900 | $82,500 |
| 2013 | $2,293 | $95,400 | $12,900 | $82,500 |
Source: Public Records
Map
Nearby Homes