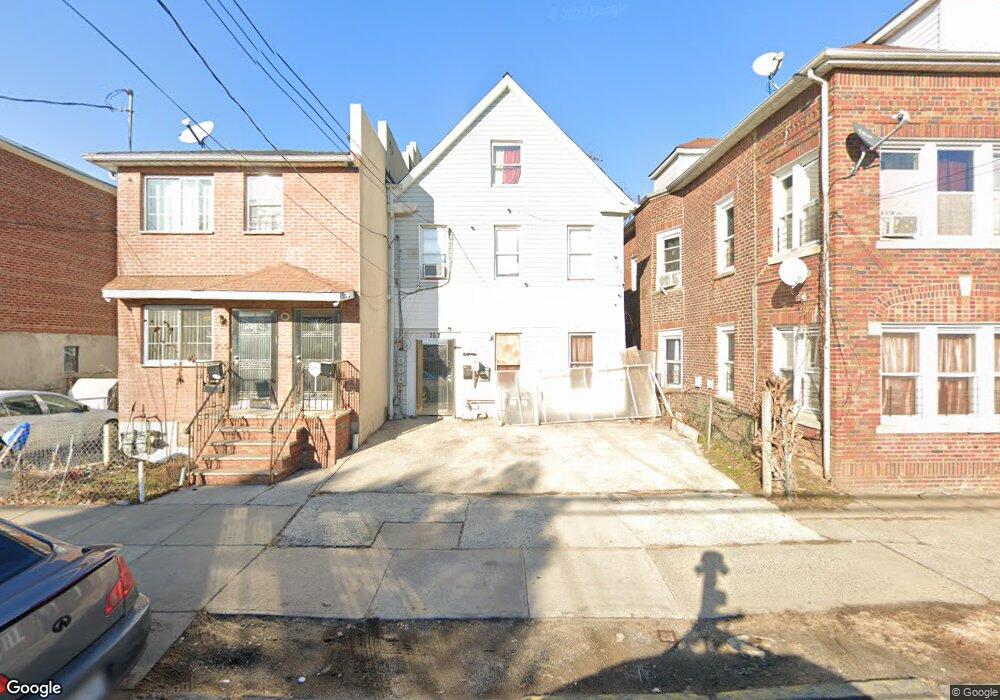
755 E 228th St Bronx, NY 10466
Wakefield NeighborhoodEstimated Value: $877,898 - $1,099,000
Studio
--
Bath
2,660
Sq Ft
$377/Sq Ft
Est. Value
About This Home
This home is located at 755 E 228th St, Bronx, NY 10466 and is currently estimated at $1,001,725, approximately $376 per square foot. 755 E 228th St is a home located in Bronx County with nearby schools including Ps 21 Philip H Sheridan, North Bronx School of Empowerment, and Bronx Charter School For Excellence 4.
Ownership History
Date
Name
Owned For
Owner Type
Purchase Details
Closed on
Oct 25, 2023
Sold by
Merleen Revocable Living Trust and Merleen Riddai As Trustee
Bought by
Ab 173Rd Realty Corp
Current Estimated Value
Home Financials for this Owner
Home Financials are based on the most recent Mortgage that was taken out on this home.
Original Mortgage
$577,500
Outstanding Balance
$567,054
Interest Rate
7.31%
Mortgage Type
Purchase Money Mortgage
Estimated Equity
$434,671
Purchase Details
Closed on
Jul 20, 2020
Sold by
Riddai Merleen
Bought by
Merleen Revocable Living Trust and Merleen Riddai As Trustee Of The
Purchase Details
Closed on
Jan 6, 2014
Sold by
Balkaran Jean
Bought by
Riddai Merleen
Purchase Details
Closed on
Dec 21, 2012
Sold by
Persad Hanso
Bought by
Balkaran Jean
Purchase Details
Closed on
Nov 12, 2009
Sold by
Sanasie Kamal
Bought by
Persad Hanso
Create a Home Valuation Report for This Property
The Home Valuation Report is an in-depth analysis detailing your home's value as well as a comparison with similar homes in the area
Home Values in the Area
Average Home Value in this Area
Purchase History
| Date | Buyer | Sale Price | Title Company |
|---|---|---|---|
| Ab 173Rd Realty Corp | -- | -- | |
| Merleen Revocable Living Trust | -- | -- | |
| Riddai Merleen | -- | -- | |
| Balkaran Jean | -- | -- | |
| Persad Hanso | -- | -- |
Source: Public Records
Mortgage History
| Date | Status | Borrower | Loan Amount |
|---|---|---|---|
| Open | Ab 173Rd Realty Corp | $577,500 |
Source: Public Records
Tax History
| Year | Tax Paid | Tax Assessment Tax Assessment Total Assessment is a certain percentage of the fair market value that is determined by local assessors to be the total taxable value of land and additions on the property. | Land | Improvement |
|---|---|---|---|---|
| 2025 | $8,956 | $44,928 | $8,294 | $36,634 |
| 2024 | $8,956 | $44,591 | $8,058 | $36,533 |
| 2023 | $8,543 | $42,067 | $7,945 | $34,122 |
| 2022 | $7,923 | $51,480 | $9,780 | $41,700 |
| 2021 | $7,879 | $42,600 | $9,780 | $32,820 |
| 2020 | $7,914 | $42,780 | $9,780 | $33,000 |
| 2019 | $7,644 | $42,600 | $9,780 | $32,820 |
| 2018 | $7,146 | $35,056 | $9,701 | $25,355 |
| 2017 | $6,742 | $33,072 | $9,183 | $23,889 |
| 2016 | $6,237 | $31,200 | $9,780 | $21,420 |
| 2015 | $5,063 | $32,640 | $10,860 | $21,780 |
| 2014 | $5,063 | $32,640 | $10,860 | $21,780 |
Source: Public Records
Map
Nearby Homes
- 738 E 229th St
- 741 E 227th St
- 745 E 231st St Unit 3F
- 745 E 231 St Unit 6A
- 745 E 231 St Unit 1F
- 740 E 232nd St Unit 6G
- 740 E 232nd St Unit 6H
- 740 E 232nd St Unit TD
- 740 E 232 St Unit TB
- 730 E 232nd St Unit 3G
- 717 E 226th St
- 825 E 230th St
- 833 E 229th St
- 836 E 229th St
- 667 E 230th St
- 839 E 228th St
- 761 E 232nd St
- 854 E 229th St
- 636 E 230th St
- 841 E 226th St
- 757 E 228 St
- 757 E 228th St
- 753 E 228th St
- 753 E 228 St
- 761 E 228th St
- 761 E 228th St Unit 9
- 747 E 228th St
- 763 E 228th St
- 743 E 228th St
- 754 E 229th St
- 765 E 228th St
- 760 E 229th St
- 750 E 229th St
- 756 E 229th St
- 748 E 229th St
- 758 E 229th St Unit 3
- 758 E 229th St
- 739 E 228 St Unit 3
- 739 E 228th St Unit 3
- 739 E 228th St
Your Personal Tour Guide
Ask me questions while you tour the home.