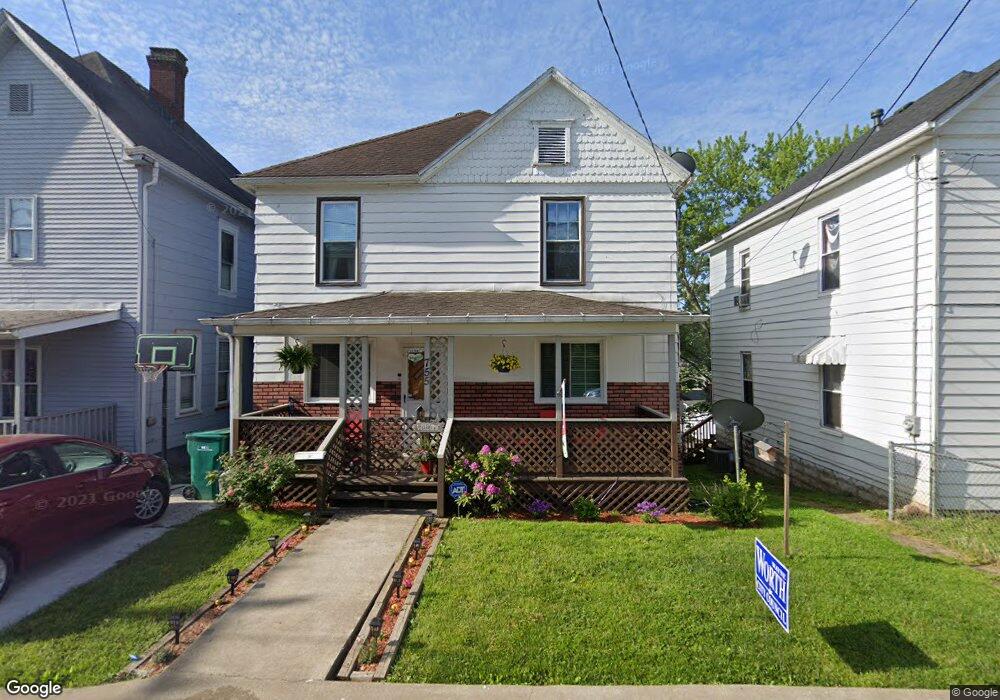
755 Locust Ave Clarksburg, WV 26301
Estimated Value: $72,336 - $134,000
4
Beds
2
Baths
1,722
Sq Ft
$59/Sq Ft
Est. Value
About This Home
This home is located at 755 Locust Ave, Clarksburg, WV 26301 and is currently estimated at $102,084, approximately $59 per square foot. 755 Locust Ave is a home located in Harrison County with nearby schools including St. Mary's Grade School, Emmanuel Christian School, and Notre Dame Middle School and Notre Dame High School.
Ownership History
Date
Name
Owned For
Owner Type
Purchase Details
Closed on
Jun 30, 2025
Sold by
Mathews Terry L and Mathews Amanda B
Bought by
Tc Legacy Holdings Llc
Current Estimated Value
Home Financials for this Owner
Home Financials are based on the most recent Mortgage that was taken out on this home.
Original Mortgage
$112,000
Outstanding Balance
$93,860
Interest Rate
6.84%
Mortgage Type
Construction
Estimated Equity
$8,224
Purchase Details
Closed on
May 13, 2015
Sold by
Henderson Oral E
Bought by
Mathews Terry L and Mathews Amanda B
Purchase Details
Closed on
Jul 23, 2012
Sold by
Citifinancial Inc
Bought by
Henderson Oral
Purchase Details
Closed on
Feb 7, 2011
Sold by
Gregory Donald E and Gregory Debra
Bought by
Roman L F
Purchase Details
Closed on
Jan 5, 2011
Sold by
Teays Valley Trustees Llc
Bought by
Citifinancial Inc
Create a Home Valuation Report for This Property
The Home Valuation Report is an in-depth analysis detailing your home's value as well as a comparison with similar homes in the area
Home Values in the Area
Average Home Value in this Area
Purchase History
| Date | Buyer | Sale Price | Title Company |
|---|---|---|---|
| Tc Legacy Holdings Llc | $65,000 | None Listed On Document | |
| Tc Legacy Holdings Llc | $65,000 | None Listed On Document | |
| Mathews Terry L | $82,000 | None Available | |
| Henderson Oral | $1,300 | None Available | |
| Roman L F | -- | None Available | |
| Citifinancial Inc | -- | None Available |
Source: Public Records
Mortgage History
| Date | Status | Borrower | Loan Amount |
|---|---|---|---|
| Open | Tc Legacy Holdings Llc | $112,000 | |
| Closed | Tc Legacy Holdings Llc | $112,000 |
Source: Public Records
Tax History Compared to Growth
Tax History
| Year | Tax Paid | Tax Assessment Tax Assessment Total Assessment is a certain percentage of the fair market value that is determined by local assessors to be the total taxable value of land and additions on the property. | Land | Improvement |
|---|---|---|---|---|
| 2025 | $540 | $35,040 | $6,780 | $28,260 |
| 2024 | $540 | $32,880 | $6,780 | $26,100 |
| 2023 | $500 | $30,720 | $6,780 | $23,940 |
| 2022 | $473 | $30,480 | $6,780 | $23,700 |
| 2021 | $465 | $30,180 | $6,780 | $23,400 |
| 2020 | $457 | $29,880 | $6,780 | $23,100 |
| 2019 | $455 | $29,760 | $6,780 | $22,980 |
| 2018 | $448 | $29,400 | $6,780 | $22,620 |
| 2017 | $440 | $28,980 | $6,780 | $22,200 |
| 2016 | $413 | $27,480 | $5,700 | $21,780 |
| 2015 | $814 | $26,940 | $5,700 | $21,240 |
| 2014 | $757 | $25,080 | $4,140 | $20,940 |
Source: Public Records
Map
Nearby Homes
- 735 Mulberry Ave
- 655/655 1/2 Mulberry Ave
- 645 Mulberry Ave
- 614 W Main St
- 124 N Chestnut St
- 31 cupid dr Cupid Dr
- 247 Park Blvd
- 403 S Chestnut St
- 439 S Chestnut St
- 150 Coleman Ave
- 311 Stealey Ave
- 992 W Pike St
- 949 Washburn St
- 328.5 Milford St
- 426 Duff Ave
- 342 Lee Ave
- 339 S 22nd St
- 1432 Farland Ave
- 312 Clark St
- 309 S 23rd St
- 757 Locust Ave
- 751 Locust Ave
- 759 Locust Ave
- 116 Gandy St
- 749 Locust Ave
- 747 Mulberry Ave
- 112 Gandy St
- 115 Gandy St
- 752 Locust Ave
- 743 Locust Ave
- 110 Gandy St
- 756 Locust Ave
- 748 Locust Ave
- 108 Gandy St
- 741 Locust Ave
- 739 Locust Ave
- 736 Camden Place Unit 738
- 740 Locust Ave
- 784 Locust Ave
- 743 Camden Place