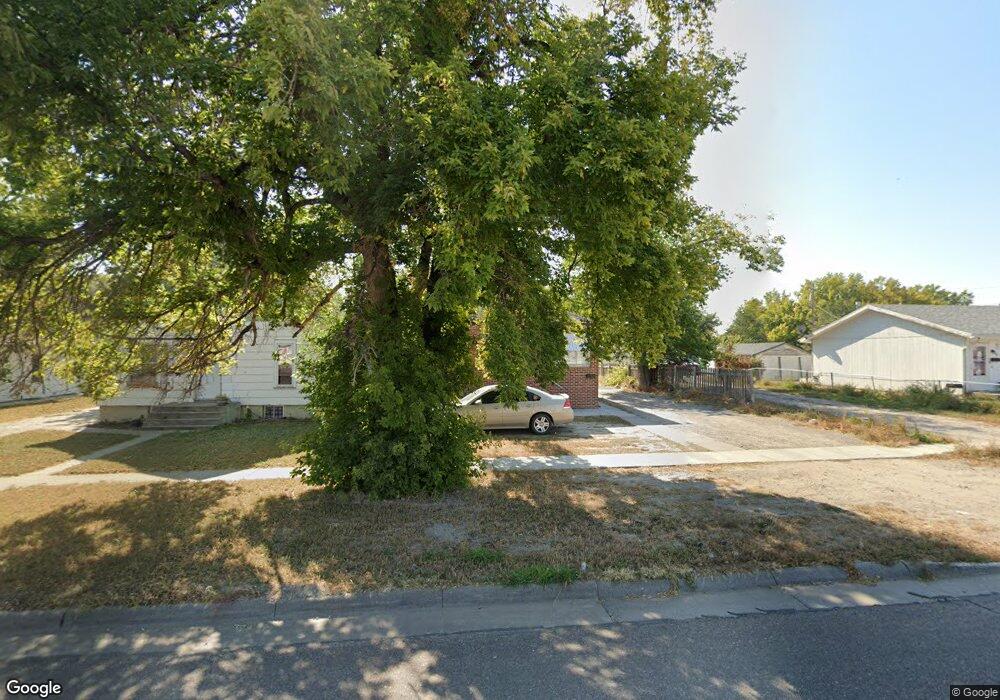
755 M St Gering, NE 69341
Estimated Value: $110,000 - $158,684
3
Beds
2
Baths
885
Sq Ft
$148/Sq Ft
Est. Value
About This Home
This home is located at 755 M St, Gering, NE 69341 and is currently estimated at $130,921, approximately $147 per square foot. 755 M St is a home located in Scotts Bluff County with nearby schools including Gering High School and Community Christian Elementary/Middle School.
Ownership History
Date
Name
Owned For
Owner Type
Purchase Details
Closed on
Nov 28, 2022
Sold by
Evans Eiko
Bought by
Evans Eiko and Groves Fred
Current Estimated Value
Purchase Details
Closed on
Feb 12, 2013
Sold by
Strong Frank A and Strong Jody M
Bought by
Barraza Manuel and Barraza Elizabeth
Home Financials for this Owner
Home Financials are based on the most recent Mortgage that was taken out on this home.
Original Mortgage
$50,000
Interest Rate
3.44%
Mortgage Type
Future Advance Clause Open End Mortgage
Create a Home Valuation Report for This Property
The Home Valuation Report is an in-depth analysis detailing your home's value as well as a comparison with similar homes in the area
Home Values in the Area
Average Home Value in this Area
Purchase History
| Date | Buyer | Sale Price | Title Company |
|---|---|---|---|
| Evans Eiko | -- | None Listed On Document | |
| Barraza Manuel | $55,000 | Ferquson Title Serices |
Source: Public Records
Mortgage History
| Date | Status | Borrower | Loan Amount |
|---|---|---|---|
| Previous Owner | Barraza Manuel | $50,000 |
Source: Public Records
Tax History Compared to Growth
Tax History
| Year | Tax Paid | Tax Assessment Tax Assessment Total Assessment is a certain percentage of the fair market value that is determined by local assessors to be the total taxable value of land and additions on the property. | Land | Improvement |
|---|---|---|---|---|
| 2024 | $2,243 | $126,855 | $25,375 | $101,480 |
| 2023 | $1,891 | $88,243 | $5,775 | $82,468 |
| 2022 | $1,891 | $88,243 | $5,775 | $82,468 |
| 2021 | $1,795 | $82,848 | $5,775 | $77,073 |
| 2020 | $1,726 | $79,178 | $5,775 | $73,403 |
| 2019 | $1,684 | $79,178 | $5,775 | $73,403 |
| 2018 | $1,683 | $78,653 | $5,250 | $73,403 |
| 2017 | $1,610 | $75,158 | $5,250 | $69,908 |
| 2016 | $1,495 | $75,158 | $5,250 | $69,908 |
| 2015 | $1,449 | $73,122 | $5,250 | $67,872 |
| 2014 | $1,470 | $73,122 | $5,250 | $67,872 |
| 2012 | -- | $71,791 | $5,250 | $66,541 |
Source: Public Records
Map
Nearby Homes