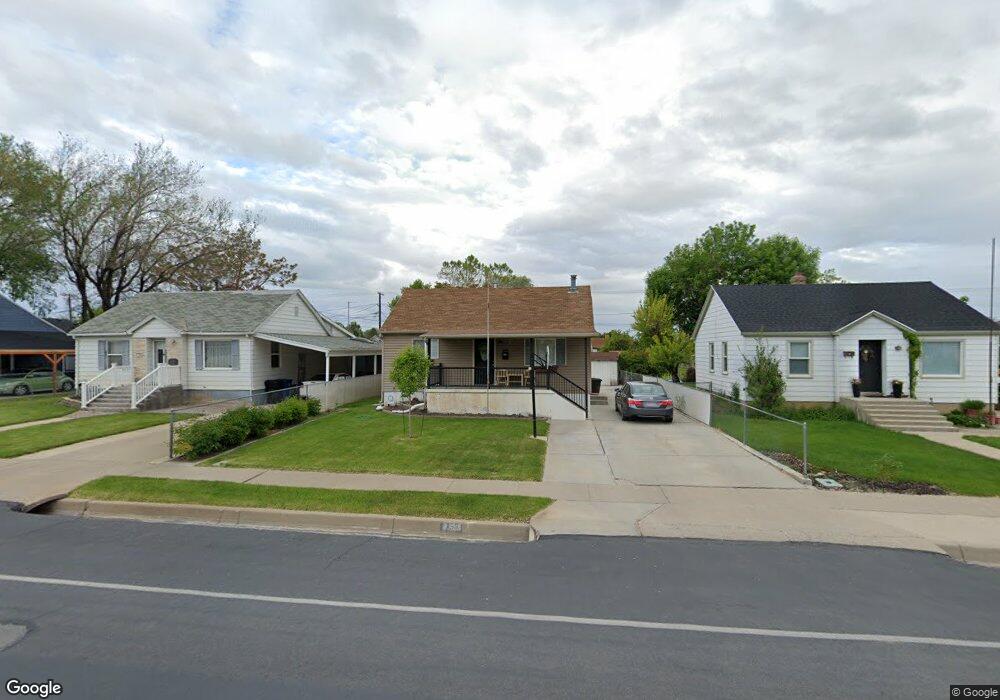
755 N 400 E Spanish Fork, UT 84660
Estimated Value: $358,000 - $406,000
3
Beds
2
Baths
1,512
Sq Ft
$257/Sq Ft
Est. Value
About This Home
This home is located at 755 N 400 E, Spanish Fork, UT 84660 and is currently estimated at $388,962, approximately $257 per square foot. 755 N 400 E is a home located in Utah County with nearby schools including Park Elementary School, Spanish Fork Jr High School, and Spanish Fork High School.
Ownership History
Date
Name
Owned For
Owner Type
Purchase Details
Closed on
Aug 30, 2023
Sold by
North Colby R
Bought by
Olson Savannah and Olson Joshua
Current Estimated Value
Home Financials for this Owner
Home Financials are based on the most recent Mortgage that was taken out on this home.
Original Mortgage
$397,664
Outstanding Balance
$386,052
Interest Rate
6.12%
Mortgage Type
FHA
Estimated Equity
$2,910
Purchase Details
Closed on
Apr 17, 2018
Sold by
Bell Kenneth A and Bell Sue Anne
Bought by
North Colby R
Home Financials for this Owner
Home Financials are based on the most recent Mortgage that was taken out on this home.
Original Mortgage
$200,000
Interest Rate
4.46%
Mortgage Type
New Conventional
Create a Home Valuation Report for This Property
The Home Valuation Report is an in-depth analysis detailing your home's value as well as a comparison with similar homes in the area
Home Values in the Area
Average Home Value in this Area
Purchase History
| Date | Buyer | Sale Price | Title Company |
|---|---|---|---|
| Olson Savannah | -- | Pro Title & Escrow | |
| North Colby R | -- | Key Land Ttle |
Source: Public Records
Mortgage History
| Date | Status | Borrower | Loan Amount |
|---|---|---|---|
| Open | Olson Savannah | $397,664 | |
| Previous Owner | North Colby R | $200,000 |
Source: Public Records
Tax History
| Year | Tax Paid | Tax Assessment Tax Assessment Total Assessment is a certain percentage of the fair market value that is determined by local assessors to be the total taxable value of land and additions on the property. | Land | Improvement |
|---|---|---|---|---|
| 2025 | $1,604 | $187,605 | -- | -- |
| 2024 | $1,604 | $165,275 | $0 | $0 |
| 2023 | $1,514 | $156,255 | $0 | $0 |
| 2022 | $1,599 | $161,810 | $0 | $0 |
| 2021 | $1,353 | $219,000 | $77,900 | $141,100 |
| 2020 | $1,220 | $192,000 | $64,900 | $127,100 |
| 2019 | $1,059 | $175,400 | $64,900 | $110,500 |
| 2018 | $1,006 | $161,000 | $64,900 | $96,100 |
| 2017 | $879 | $75,625 | $0 | $0 |
| 2016 | $785 | $66,660 | $0 | $0 |
| 2015 | $719 | $60,335 | $0 | $0 |
| 2014 | $667 | $56,155 | $0 | $0 |
Source: Public Records
Map
Nearby Homes
Your Personal Tour Guide
Ask me questions while you tour the home.