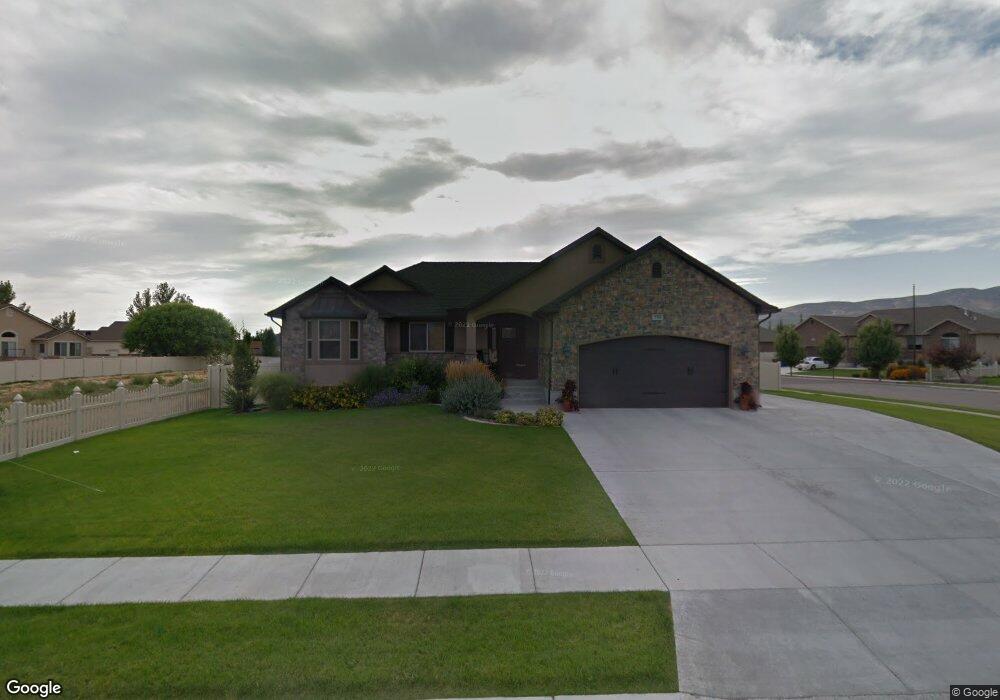
755 N 900 W Tremonton, UT 84337
Estimated Value: $511,000 - $602,000
5
Beds
4
Baths
3,296
Sq Ft
$163/Sq Ft
Est. Value
About This Home
This home is located at 755 N 900 W, Tremonton, UT 84337 and is currently estimated at $537,743, approximately $163 per square foot. 755 N 900 W is a home located in Box Elder County with nearby schools including North Park School, Alice C. Harris Intermediate School, and Bear River Middle School.
Ownership History
Date
Name
Owned For
Owner Type
Purchase Details
Closed on
Jun 12, 2024
Sold by
Souter Tim R and Souter Jolynn Bushnell
Bought by
Tim And Jolynn Souter Lint-Lng Trust and Souter
Current Estimated Value
Purchase Details
Closed on
Dec 31, 2015
Sold by
Nelson Chris M and Nelson Vickie L
Bought by
Souter Tim R and Souter Joyynn Bushnell
Home Financials for this Owner
Home Financials are based on the most recent Mortgage that was taken out on this home.
Original Mortgage
$263,853
Interest Rate
3.94%
Mortgage Type
New Conventional
Purchase Details
Closed on
Nov 28, 2011
Sold by
Nelson Chris M and Nelson Vicki L
Bought by
Nelson Chris M and Nelson Vicki L
Purchase Details
Closed on
Aug 29, 2011
Sold by
Rose Aluminum Inc
Bought by
Nelson Chris M and Simmons Vickie
Home Financials for this Owner
Home Financials are based on the most recent Mortgage that was taken out on this home.
Original Mortgage
$120,000
Interest Rate
4.43%
Mortgage Type
New Conventional
Create a Home Valuation Report for This Property
The Home Valuation Report is an in-depth analysis detailing your home's value as well as a comparison with similar homes in the area
Home Values in the Area
Average Home Value in this Area
Purchase History
| Date | Buyer | Sale Price | Title Company |
|---|---|---|---|
| Tim And Jolynn Souter Lint-Lng Trust | -- | None Listed On Document | |
| Souter Tim R | -- | American Secure Title Tremon | |
| Nelson Chris M | -- | None Available | |
| Nelson Chris M | -- | Box Elder Land Title Co |
Source: Public Records
Mortgage History
| Date | Status | Borrower | Loan Amount |
|---|---|---|---|
| Previous Owner | Souter Tim R | $263,853 | |
| Previous Owner | Nelson Chris M | $120,000 |
Source: Public Records
Tax History Compared to Growth
Tax History
| Year | Tax Paid | Tax Assessment Tax Assessment Total Assessment is a certain percentage of the fair market value that is determined by local assessors to be the total taxable value of land and additions on the property. | Land | Improvement |
|---|---|---|---|---|
| 2025 | $3,493 | $533,413 | $105,000 | $428,413 |
| 2024 | $3,048 | $516,969 | $105,000 | $411,969 |
| 2023 | $3,163 | $526,932 | $100,000 | $426,932 |
| 2022 | $2,858 | $271,428 | $19,250 | $252,178 |
| 2021 | $2,453 | $319,787 | $35,000 | $284,787 |
| 2020 | $2,114 | $319,787 | $35,000 | $284,787 |
| 2019 | $1,956 | $157,863 | $19,250 | $138,613 |
| 2018 | $1,718 | $128,878 | $19,250 | $109,628 |
| 2017 | $1,802 | $234,323 | $19,250 | $199,323 |
| 2016 | $1,770 | $123,657 | $19,250 | $104,407 |
| 2015 | $1,603 | $114,166 | $19,250 | $94,916 |
| 2014 | $1,603 | $109,646 | $19,250 | $90,396 |
| 2013 | -- | $109,646 | $19,273 | $90,373 |
Source: Public Records
Map
Nearby Homes
- 113 N 900 W
- 910 W 800 N
- 955 W 720 N
- 967 W 820 N
- 256 N 870 E Unit 18
- 234 N 870 E Unit 19
- 867 N 930 W Unit 82
- 805 N 980 W
- 824 N 980 W
- Lyndhurst Plan at Archibald Estates - Tremonton (Active Adult Homes)
- Hawthorne Plan at Envision Estates - Tremonton
- Lyndhurst Plan at Envision Estates - Tremonton
- Aberdeen Plan at Envision Estates - Tremonton
- Magnolia Plan at Envision Estates - Tremonton
- Hemlock Plan at Envision Estates - Tremonton
- Glendale Plan at Envision Estates - Tremonton
- Hilldale Plan at Archibald Estates - Tremonton (Active Adult Homes)
- Blackberry Plan at Envision Estates - Tremonton
- Hayden Plan at Envision Estates - Tremonton
- Eucalyptus Plan at Envision Estates - Tremonton