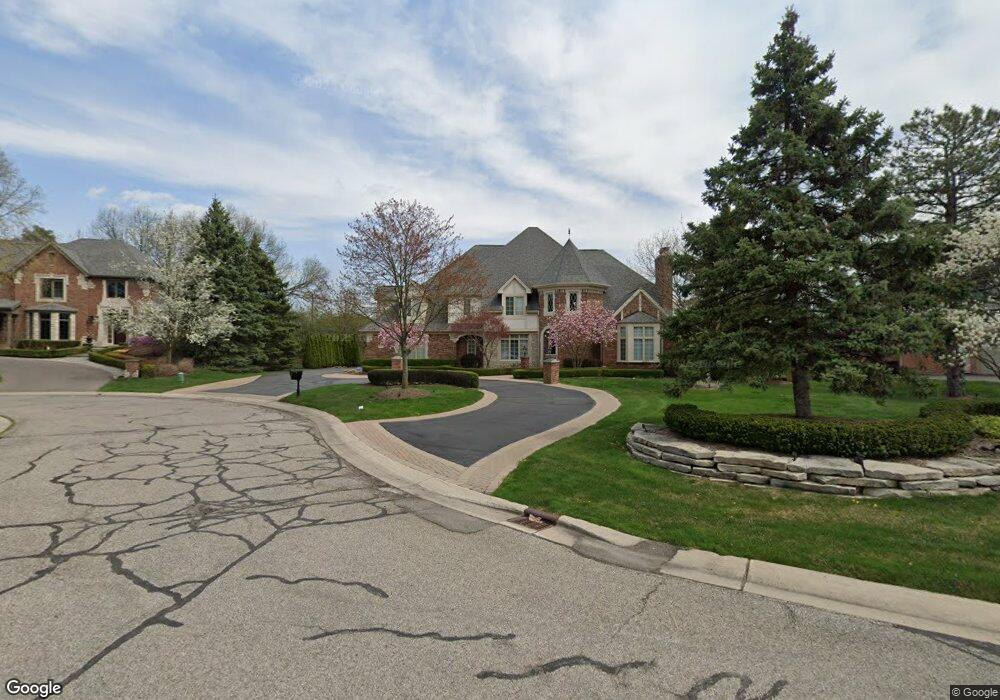
755 Palms Rd Bloomfield Hills, MI 48304
Estimated Value: $1,626,000 - $2,332,000
4
Beds
6
Baths
5,000
Sq Ft
$406/Sq Ft
Est. Value
About This Home
This home is located at 755 Palms Rd, Bloomfield Hills, MI 48304 and is currently estimated at $2,030,640, approximately $406 per square foot. 755 Palms Rd is a home located in Oakland County with nearby schools including Eastover Elementary School, Bloomfield Hills High School, and Arts & Technology Academy of Pontiac.
Ownership History
Date
Name
Owned For
Owner Type
Purchase Details
Closed on
Sep 8, 2009
Sold by
Janetzke Ellen Amanda and Wrobel Kenneth J
Bought by
Naaman Saad C and Naaman Dunia
Current Estimated Value
Purchase Details
Closed on
Apr 4, 2008
Sold by
Hinman Patrick Walter
Bought by
Janetzke Ellen Amanda
Purchase Details
Closed on
Aug 18, 2005
Sold by
Casadei Homes Inc
Bought by
Hinman Patrick W and Hinman Ellen A
Purchase Details
Closed on
May 14, 2004
Sold by
Eastways Farm Llc
Bought by
Casadel Development Inc
Create a Home Valuation Report for This Property
The Home Valuation Report is an in-depth analysis detailing your home's value as well as a comparison with similar homes in the area
Home Values in the Area
Average Home Value in this Area
Purchase History
| Date | Buyer | Sale Price | Title Company |
|---|---|---|---|
| Naaman Saad C | $800,000 | Ltic | |
| Janetzke Ellen Amanda | -- | None Available | |
| Hinman Patrick W | -- | Philip R Seaver Title Co Inc | |
| Casadel Development Inc | -- | -- |
Source: Public Records
Tax History Compared to Growth
Tax History
| Year | Tax Paid | Tax Assessment Tax Assessment Total Assessment is a certain percentage of the fair market value that is determined by local assessors to be the total taxable value of land and additions on the property. | Land | Improvement |
|---|---|---|---|---|
| 2024 | $11,445 | $995,500 | $0 | $0 |
| 2023 | $11,076 | $934,810 | $0 | $0 |
| 2022 | $20,815 | $842,560 | $0 | $0 |
| 2021 | $20,665 | $702,860 | $0 | $0 |
| 2020 | $10,130 | $621,500 | $0 | $0 |
| 2019 | $19,445 | $687,790 | $0 | $0 |
| 2018 | $19,534 | $770,480 | $0 | $0 |
| 2017 | $19,394 | $749,270 | $0 | $0 |
| 2016 | $19,430 | $733,980 | $0 | $0 |
| 2015 | -- | $662,650 | $0 | $0 |
| 2014 | -- | $575,250 | $0 | $0 |
| 2011 | -- | $593,300 | $0 | $0 |
Source: Public Records
Map
Nearby Homes
- 700 E Square Lake Rd
- 2755 Hunters Hill Rd
- 2409 Wildbrook Run Unit 182
- 692 Brockmoor Ln
- 584 Cambridge Way Unit 522
- 536 Cambridge Way
- 457 Cambridge Way
- 909 Tartan Trail Unit 203
- 2156 Park Ridge Dr
- 2615 Warwick Dr
- 689 E Fox Hills Dr Unit 65
- 635 E Fox Hills Dr Unit F41
- 654 E Fox Hills Dr
- 667 E Fox Hills Dr Unit H59
- 587 E Fox Hills Dr
- 737 E Fox Hills Dr Unit 180
- 723 E Fox Hills Dr Unit X186
- 448 Fox Hills Dr S Unit 3
- 1916 Squirrel Valley Dr
- 433 Fox Hills Dr S Unit 5
- 795 Palms Rd
- 729 Palms Rd
- 2574 Ginger Ct
- 817 Palms Rd
- 756 Palms Rd
- 2596 Ginger Ct
- 734 Palms Rd
- 794 Palms Rd
- 778 Kingston Ct
- 2552 Ginger Ct
- 838 Palms Rd
- 775 Kingston Ct
- 776 Kingston Ct
- 2595 Ginger Ct
- 860 Palms Rd
- 2573 Ginger Ct
- 778 E Square Lake Rd
- 2430 Wildbrook Run Unit 161
- 774 Kingston Ct
- 793 Foxhall Rd