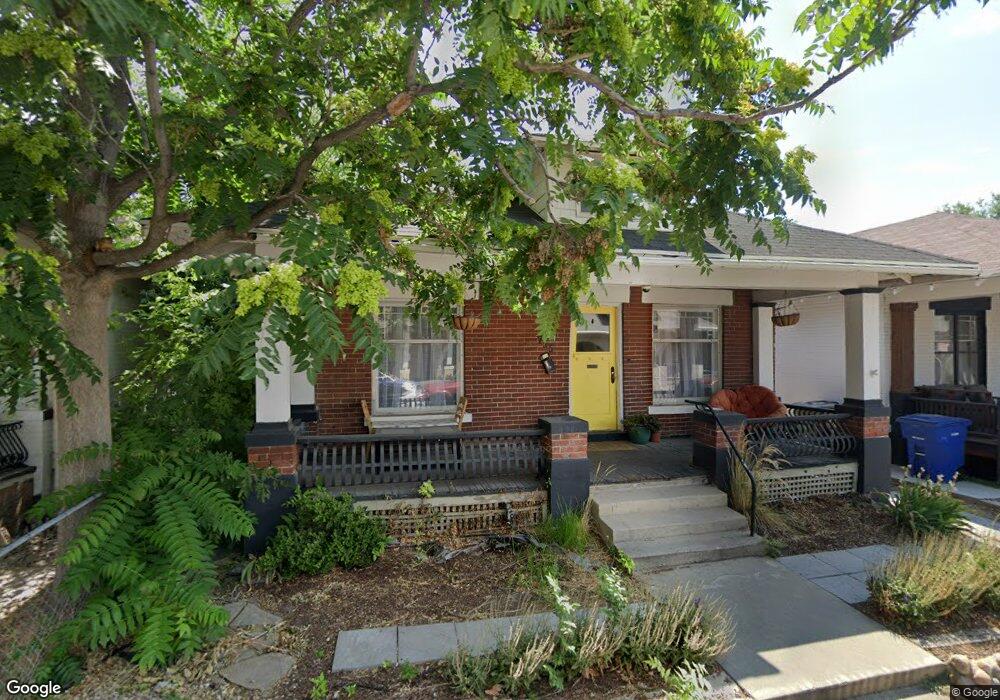
755 Park St Salt Lake City, UT 84102
Central City NeighborhoodEstimated Value: $377,000 - $494,000
1
Bed
1
Bath
784
Sq Ft
$566/Sq Ft
Est. Value
About This Home
This home is located at 755 Park St, Salt Lake City, UT 84102 and is currently estimated at $443,559, approximately $565 per square foot. 755 Park St is a home located in Salt Lake County with nearby schools including Bennion Elementary School, Liberty Elementary School, and Highland High School.
Ownership History
Date
Name
Owned For
Owner Type
Purchase Details
Closed on
Mar 31, 1997
Sold by
Argyle Lisa M
Bought by
Bitner Marilee
Current Estimated Value
Home Financials for this Owner
Home Financials are based on the most recent Mortgage that was taken out on this home.
Original Mortgage
$78,170
Outstanding Balance
$9,877
Interest Rate
7.63%
Mortgage Type
FHA
Estimated Equity
$433,682
Purchase Details
Closed on
Oct 22, 1996
Sold by
Argle Scott D and Argyle Lisa M
Bought by
Argyle Lisa M
Home Financials for this Owner
Home Financials are based on the most recent Mortgage that was taken out on this home.
Original Mortgage
$71,200
Interest Rate
8.3%
Create a Home Valuation Report for This Property
The Home Valuation Report is an in-depth analysis detailing your home's value as well as a comparison with similar homes in the area
Home Values in the Area
Average Home Value in this Area
Purchase History
| Date | Buyer | Sale Price | Title Company |
|---|---|---|---|
| Bitner Marilee | -- | Paramount Title Corp | |
| Argyle Lisa M | -- | -- |
Source: Public Records
Mortgage History
| Date | Status | Borrower | Loan Amount |
|---|---|---|---|
| Open | Bitner Marilee | $78,170 | |
| Previous Owner | Argyle Lisa M | $71,200 |
Source: Public Records
Tax History Compared to Growth
Tax History
| Year | Tax Paid | Tax Assessment Tax Assessment Total Assessment is a certain percentage of the fair market value that is determined by local assessors to be the total taxable value of land and additions on the property. | Land | Improvement |
|---|---|---|---|---|
| 2025 | $2,048 | $414,200 | $121,900 | $292,300 |
| 2024 | $2,048 | $390,700 | $115,400 | $275,300 |
| 2023 | $2,048 | $382,900 | $157,500 | $225,400 |
| 2022 | $2,239 | $386,400 | $97,900 | $288,500 |
| 2021 | $1,959 | $306,000 | $76,700 | $229,300 |
| 2020 | $1,337 | $198,800 | $68,800 | $130,000 |
| 2019 | $1,355 | $189,500 | $50,800 | $138,700 |
| 2018 | $1,319 | $179,700 | $50,800 | $128,900 |
| 2017 | $1,425 | $181,900 | $50,800 | $131,100 |
| 2016 | $1,366 | $165,600 | $52,300 | $113,300 |
| 2015 | $1,279 | $146,900 | $51,300 | $95,600 |
| 2014 | $1,295 | $147,600 | $52,900 | $94,700 |
Source: Public Records
Map
Nearby Homes