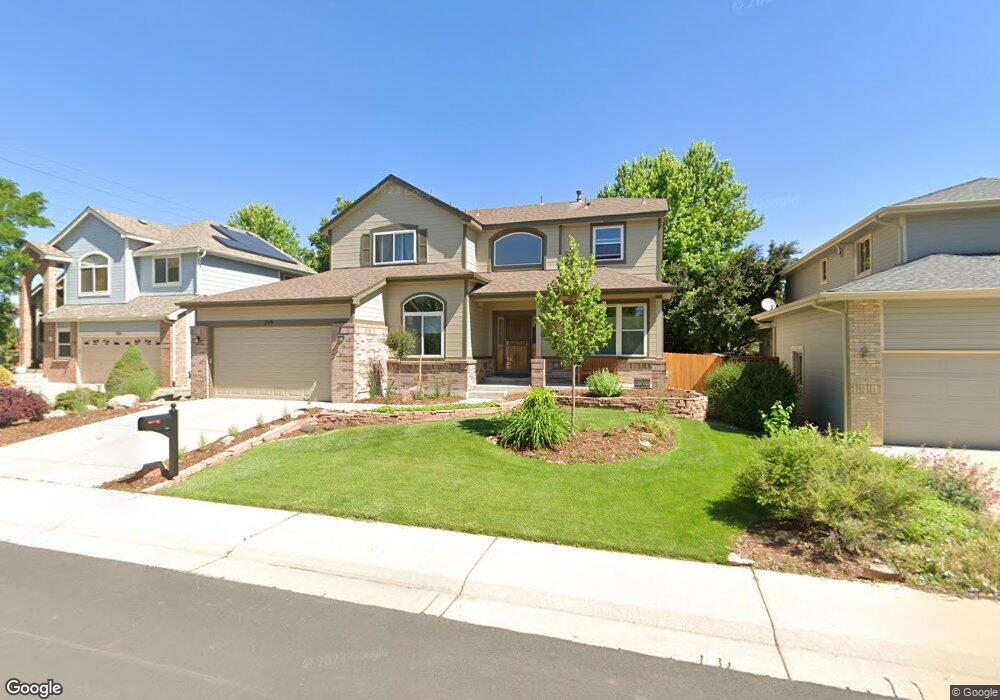
755 Pear Ct Louisville, CO 80027
Estimated Value: $1,007,564 - $1,187,000
4
Beds
3
Baths
2,328
Sq Ft
$469/Sq Ft
Est. Value
About This Home
This home is located at 755 Pear Ct, Louisville, CO 80027 and is currently estimated at $1,091,391, approximately $468 per square foot. 755 Pear Ct is a home located in Boulder County with nearby schools including Monarch K-8 School, Monarch High School, and The Goddard School - Louisville.
Ownership History
Date
Name
Owned For
Owner Type
Purchase Details
Closed on
Nov 1, 2002
Sold by
Henson Thomas M and Henson Christina L
Bought by
Knight James W and Horino Michelle
Current Estimated Value
Home Financials for this Owner
Home Financials are based on the most recent Mortgage that was taken out on this home.
Original Mortgage
$290,000
Outstanding Balance
$111,161
Interest Rate
4.87%
Estimated Equity
$980,230
Purchase Details
Closed on
Oct 8, 1998
Sold by
Sheffield Homes Coal Creek Llc
Bought by
Henson Thomas M and Henson Christina L
Home Financials for this Owner
Home Financials are based on the most recent Mortgage that was taken out on this home.
Original Mortgage
$212,950
Interest Rate
6.73%
Purchase Details
Closed on
Apr 15, 1998
Sold by
The Meadows At Coal Creek Corp
Bought by
Sheffield Homes Coal Creek Llc
Purchase Details
Closed on
Feb 3, 1993
Bought by
Knight James W
Create a Home Valuation Report for This Property
The Home Valuation Report is an in-depth analysis detailing your home's value as well as a comparison with similar homes in the area
Home Values in the Area
Average Home Value in this Area
Purchase History
| Date | Buyer | Sale Price | Title Company |
|---|---|---|---|
| Knight James W | $429,900 | First Colorado Title | |
| Henson Thomas M | $266,207 | Land Title | |
| Sheffield Homes Coal Creek Llc | $40,000 | Land Title | |
| Knight James W | -- | -- |
Source: Public Records
Mortgage History
| Date | Status | Borrower | Loan Amount |
|---|---|---|---|
| Open | Knight James W | $290,000 | |
| Previous Owner | Henson Thomas M | $212,950 |
Source: Public Records
Tax History Compared to Growth
Tax History
| Year | Tax Paid | Tax Assessment Tax Assessment Total Assessment is a certain percentage of the fair market value that is determined by local assessors to be the total taxable value of land and additions on the property. | Land | Improvement |
|---|---|---|---|---|
| 2025 | $4,987 | $61,663 | $30,025 | $31,638 |
| 2024 | $4,987 | $61,663 | $30,025 | $31,638 |
| 2023 | $4,903 | $62,189 | $31,068 | $34,807 |
| 2022 | $3,948 | $47,969 | $22,303 | $25,666 |
| 2021 | $4,862 | $52,502 | $24,410 | $28,092 |
| 2020 | $4,367 | $46,661 | $21,307 | $25,354 |
| 2019 | $4,305 | $46,661 | $21,307 | $25,354 |
| 2018 | $3,981 | $44,561 | $13,680 | $30,881 |
| 2017 | $3,902 | $49,264 | $15,124 | $34,140 |
| 2016 | $3,628 | $41,241 | $15,124 | $26,117 |
| 2015 | $3,439 | $36,433 | $8,756 | $27,677 |
| 2014 | $3,115 | $36,433 | $8,756 | $27,677 |
Source: Public Records
Map
Nearby Homes
- 749 Apple Ct
- 546 Ridgeview Dr
- 362 S Taft Ct Unit 108
- 305 S Taft Ct Unit 33
- 620 Ridgeview Dr
- 323 S Taft Ct Unit 26
- 284 S Taft Ct Unit 76
- 279 S Taft Ct Unit 53
- 716 Club Cir
- 730 Copper Ln Unit 106
- 567 Manorwood Ln
- 539 Coal Creek Ln
- 641 W Dahlia St
- 203 Springs Dr
- 494 Muirfield Cir
- 159 S Polk Ave
- 118 S Tanager Ct
- 1002 Turnberry Cir
- 812 W Mulberry St
- 1030 Turnberry Cir