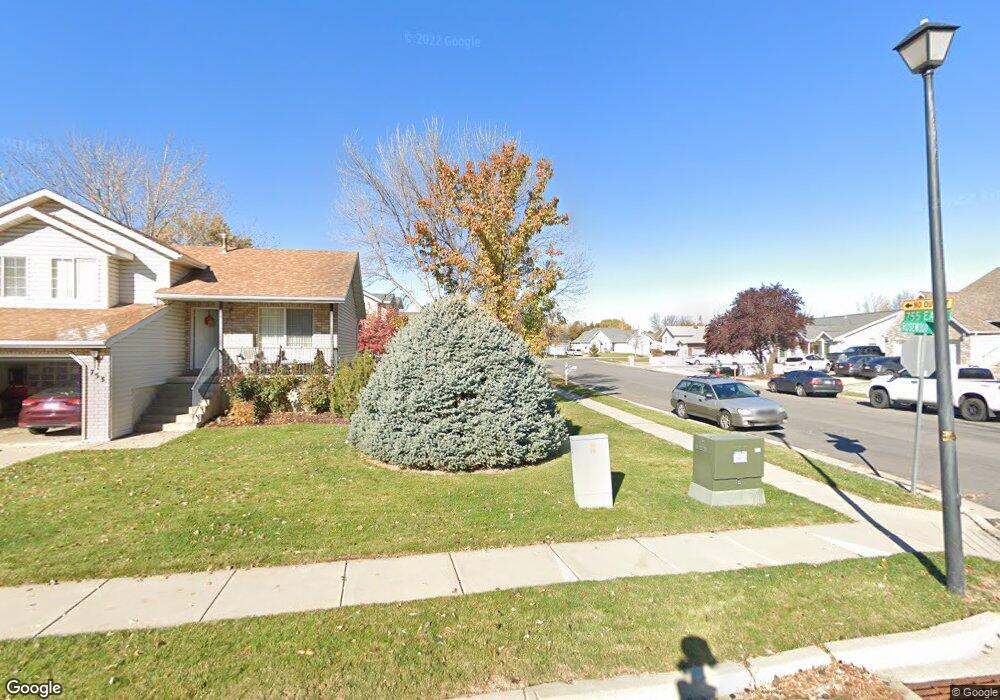
755 Rosewood Ln Layton, UT 84041
Estimated Value: $484,000 - $547,000
4
Beds
2
Baths
1,615
Sq Ft
$327/Sq Ft
Est. Value
About This Home
This home is located at 755 Rosewood Ln, Layton, UT 84041 and is currently estimated at $528,236, approximately $327 per square foot. 755 Rosewood Ln is a home located in Davis County with nearby schools including Whitesides Elementary School, Fairfield Junior High School, and Layton High School.
Ownership History
Date
Name
Owned For
Owner Type
Purchase Details
Closed on
Nov 28, 2012
Sold by
Jorgensen Colbie
Bought by
Jorgensen Colbie and Jorgensen Heather
Current Estimated Value
Home Financials for this Owner
Home Financials are based on the most recent Mortgage that was taken out on this home.
Original Mortgage
$169,866
Outstanding Balance
$116,600
Interest Rate
3.25%
Mortgage Type
FHA
Estimated Equity
$411,636
Purchase Details
Closed on
May 17, 2011
Sold by
Mccormick Todd
Bought by
Mccormick Todd
Purchase Details
Closed on
Aug 30, 2005
Sold by
Bourne Richard Bryan and Bourne Tory J
Bought by
Mccormick Todd
Home Financials for this Owner
Home Financials are based on the most recent Mortgage that was taken out on this home.
Original Mortgage
$164,000
Interest Rate
5.76%
Mortgage Type
Fannie Mae Freddie Mac
Create a Home Valuation Report for This Property
The Home Valuation Report is an in-depth analysis detailing your home's value as well as a comparison with similar homes in the area
Home Values in the Area
Average Home Value in this Area
Purchase History
| Date | Buyer | Sale Price | Title Company |
|---|---|---|---|
| Jorgensen Colbie | -- | Bonneville Superior Title Co | |
| Jorgensen Calbie | -- | Bonneville Superior Title Co | |
| Mccormick Todd | -- | Bonneville Superior Title Co | |
| Mccormick Todd | -- | Bonneville Superior | |
| Mccormick Todd | -- | Bonneville Title Company |
Source: Public Records
Mortgage History
| Date | Status | Borrower | Loan Amount |
|---|---|---|---|
| Open | Jorgensen Colbie | $169,866 | |
| Previous Owner | Mccormick Todd | $164,000 |
Source: Public Records
Tax History Compared to Growth
Tax History
| Year | Tax Paid | Tax Assessment Tax Assessment Total Assessment is a certain percentage of the fair market value that is determined by local assessors to be the total taxable value of land and additions on the property. | Land | Improvement |
|---|---|---|---|---|
| 2025 | -- | $266,200 | $126,860 | $139,340 |
| 2024 | -- | $255,749 | $146,165 | $109,584 |
| 2023 | $342 | $257,400 | $87,553 | $169,846 |
| 2022 | $342 | $476,000 | $160,785 | $315,215 |
| 2021 | $0 | $340,000 | $136,169 | $203,831 |
| 2020 | $1,440 | $298,000 | $109,357 | $188,643 |
| 2019 | $1,440 | $261,000 | $99,321 | $161,679 |
| 2018 | $0 | $237,000 | $99,321 | $137,679 |
| 2016 | $1,306 | $95,920 | $35,051 | $60,869 |
| 2015 | $1,242 | $86,625 | $35,051 | $51,574 |
| 2014 | $1,613 | $115,007 | $35,051 | $79,956 |
| 2013 | -- | $81,676 | $26,516 | $55,160 |
Source: Public Records
Map
Nearby Homes
- 818 Creekside Dr
- 617 E 405 S
- 493 E Alice Way
- 696 S Clearwater Falls Dr
- 457 E Alice Way Unit 102
- 389 Morgan St
- 110 Mill Rd
- 86 Mill Rd
- 772 N Crimson Ln
- 685 S Pheasant View Dr
- 877 S Main St Unit B
- 953 E 100 S
- 895 S Main St Unit E
- 942 E Gentile St
- 917 S Main St Unit H
- 1168 Holmes Creek Ln
- 282 E 925 S
- 268 E 900 S
- 1336 E Maple Way
- 424 W Creekside Ln