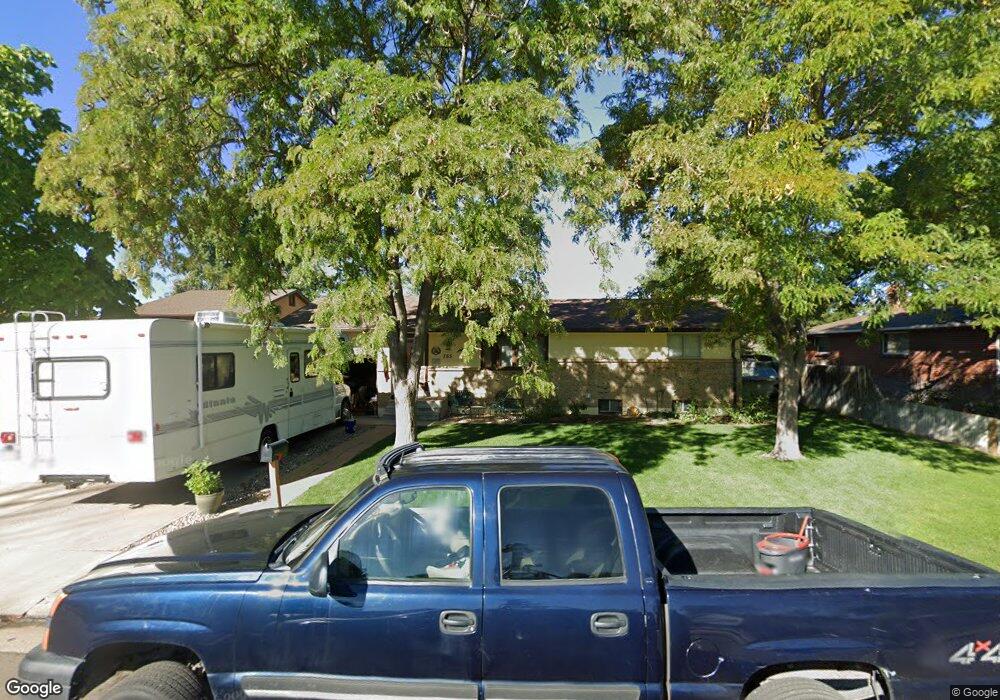
755 S 9th Ave Brighton, CO 80601
Estimated Value: $376,253 - $445,000
4
Beds
2
Baths
960
Sq Ft
$418/Sq Ft
Est. Value
About This Home
This home is located at 755 S 9th Ave, Brighton, CO 80601 and is currently estimated at $401,563, approximately $418 per square foot. 755 S 9th Ave is a home located in Adams County with nearby schools including Southeast Elementary School, Vikan Middle School, and Brighton High School.
Ownership History
Date
Name
Owned For
Owner Type
Purchase Details
Closed on
Dec 12, 2018
Sold by
Hill David Allen
Bought by
Hill David Allen and Hill Victoria Anne
Current Estimated Value
Purchase Details
Closed on
May 23, 2007
Sold by
Lucero Debbie and Lucero David
Bought by
Hill David Allen
Home Financials for this Owner
Home Financials are based on the most recent Mortgage that was taken out on this home.
Original Mortgage
$170,000
Outstanding Balance
$101,648
Interest Rate
6.22%
Mortgage Type
Unknown
Estimated Equity
$299,915
Purchase Details
Closed on
Jan 14, 2005
Sold by
Lucero Debbie
Bought by
Lucero Debbie and Lucero David
Home Financials for this Owner
Home Financials are based on the most recent Mortgage that was taken out on this home.
Original Mortgage
$148,000
Interest Rate
8.75%
Mortgage Type
New Conventional
Purchase Details
Closed on
Feb 11, 2003
Sold by
Monson John R and Monson Dorothy M
Bought by
Lucero Debbie
Purchase Details
Closed on
Jul 30, 1991
Create a Home Valuation Report for This Property
The Home Valuation Report is an in-depth analysis detailing your home's value as well as a comparison with similar homes in the area
Home Values in the Area
Average Home Value in this Area
Purchase History
| Date | Buyer | Sale Price | Title Company |
|---|---|---|---|
| Hill David Allen | -- | None Available | |
| Hill David Allen | $170,000 | Land Title Guarantee Company | |
| Lucero Debbie | -- | Fahtco | |
| Lucero Debbie | -- | -- | |
| -- | $70,000 | -- |
Source: Public Records
Mortgage History
| Date | Status | Borrower | Loan Amount |
|---|---|---|---|
| Open | Hill David Allen | $170,000 | |
| Previous Owner | Lucero Debbie | $148,000 |
Source: Public Records
Tax History
| Year | Tax Paid | Tax Assessment Tax Assessment Total Assessment is a certain percentage of the fair market value that is determined by local assessors to be the total taxable value of land and additions on the property. | Land | Improvement |
|---|---|---|---|---|
| 2025 | $2,858 | $26,180 | $5,780 | $20,400 |
| 2024 | $2,858 | $24,060 | $5,310 | $18,750 |
| 2023 | $2,845 | $29,560 | $5,480 | $24,080 |
| 2022 | $2,652 | $24,140 | $5,630 | $18,510 |
| 2021 | $2,485 | $24,140 | $5,630 | $18,510 |
| 2020 | $2,155 | $21,820 | $5,790 | $16,030 |
| 2019 | $2,157 | $21,820 | $5,790 | $16,030 |
| 2018 | $1,738 | $17,580 | $5,760 | $11,820 |
| 2017 | $1,736 | $17,580 | $5,760 | $11,820 |
| 2016 | $1,424 | $14,370 | $3,020 | $11,350 |
| 2015 | $1,421 | $14,370 | $3,020 | $11,350 |
| 2014 | -- | $12,260 | $2,470 | $9,790 |
Source: Public Records
Map
Nearby Homes
- 835 S 9th Ave
- 865 S 8th Ave
- 792 S 12th Ave
- 617 S 5th Ave
- 648 S 3rd Ave
- 285 S 8th Ave
- 628 S 16th Ave
- 765 S 1st Ave
- 141 E Bromley Ln
- 475 S 2nd Ave
- 475 S 2nd Ave Unit Plot 1
- 175 S 10th Ave
- 244 S 13th Ave
- 126 S 9th Ave
- 303 S 2nd Ave
- 219 S 3rd Ave
- 204 E Egbert St
- 113 S 4th Ave
- 107 S 4th Ave
- 135 S 3rd Ave
Your Personal Tour Guide
Ask me questions while you tour the home.