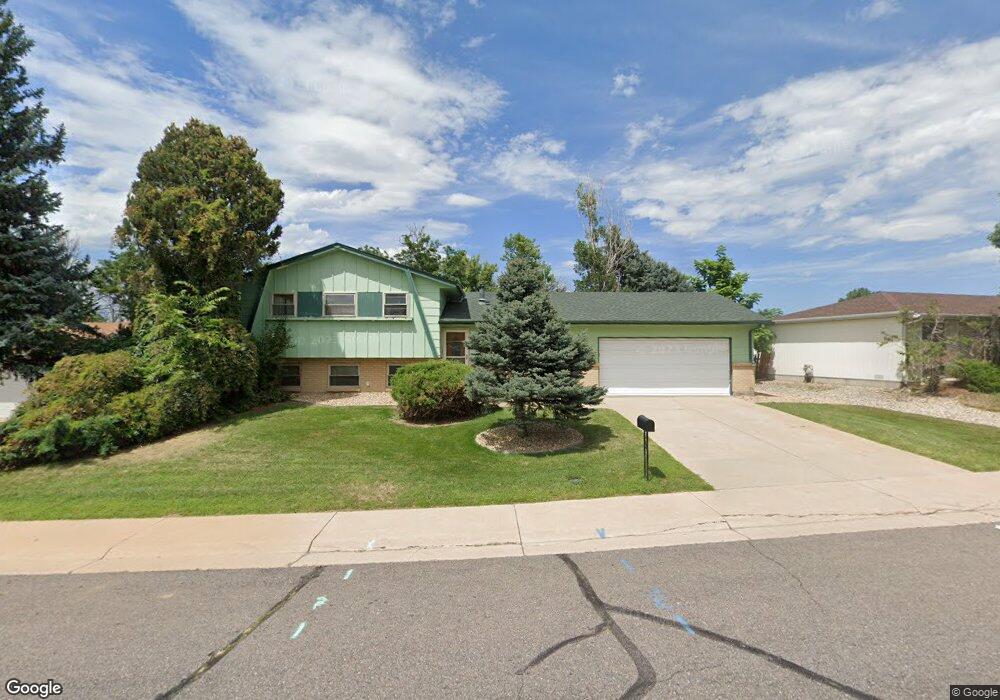
755 S Nile Way Aurora, CO 80012
Expo Park NeighborhoodEstimated Value: $420,000 - $479,000
--
Bed
2
Baths
1,132
Sq Ft
$391/Sq Ft
Est. Value
About This Home
This home is located at 755 S Nile Way, Aurora, CO 80012 and is currently estimated at $442,179, approximately $390 per square foot. 755 S Nile Way is a home located in Arapahoe County with nearby schools including Highline Community Elementary School, Prairie Middle School, and Overland High School.
Ownership History
Date
Name
Owned For
Owner Type
Purchase Details
Closed on
Jun 7, 1991
Sold by
Cenlar Federal Savings Bank
Bought by
Yount Frank M Yount Regina B
Current Estimated Value
Purchase Details
Closed on
Sep 17, 1990
Sold by
Secretary Of Housing & Urban Dev
Bought by
Cenlar Federal Savings Bank
Purchase Details
Closed on
Sep 6, 1990
Sold by
Bond Alton and Bond Lale
Bought by
Secretary Of Housing & Urban Dev
Purchase Details
Closed on
Aug 15, 1989
Sold by
Bond Alton
Bought by
Bond Alton and Bond Lale
Purchase Details
Closed on
Aug 14, 1989
Sold by
Eggebraten Curtis C
Bought by
Bond Alton
Purchase Details
Closed on
Jul 25, 1989
Sold by
Conversion Arapco
Bought by
Eggebraten Curtis C
Purchase Details
Closed on
Jan 1, 1985
Sold by
Conversion Arapco
Bought by
Conversion Arapco
Purchase Details
Closed on
Apr 1, 1977
Sold by
Conversion Arapco
Bought by
Conversion Arapco
Purchase Details
Closed on
Jul 4, 1776
Bought by
Conversion Arapco
Create a Home Valuation Report for This Property
The Home Valuation Report is an in-depth analysis detailing your home's value as well as a comparison with similar homes in the area
Home Values in the Area
Average Home Value in this Area
Purchase History
| Date | Buyer | Sale Price | Title Company |
|---|---|---|---|
| Yount Frank M Yount Regina B | -- | -- | |
| Cenlar Federal Savings Bank | -- | -- | |
| Secretary Of Housing & Urban Dev | -- | -- | |
| Bond Alton | -- | -- | |
| Bond Alton | -- | -- | |
| Eggebraten Curtis C | -- | -- | |
| Conversion Arapco | -- | -- | |
| Conversion Arapco | -- | -- | |
| Conversion Arapco | -- | -- |
Source: Public Records
Tax History Compared to Growth
Tax History
| Year | Tax Paid | Tax Assessment Tax Assessment Total Assessment is a certain percentage of the fair market value that is determined by local assessors to be the total taxable value of land and additions on the property. | Land | Improvement |
|---|---|---|---|---|
| 2024 | $1,975 | $28,542 | -- | -- |
| 2023 | $1,975 | $28,542 | $0 | $0 |
| 2022 | $1,664 | $22,970 | $0 | $0 |
| 2021 | $1,674 | $22,970 | $0 | $0 |
| 2020 | $1,755 | $24,439 | $0 | $0 |
| 2019 | $1,693 | $24,439 | $0 | $0 |
| 2018 | $1,417 | $19,217 | $0 | $0 |
| 2017 | $1,396 | $19,217 | $0 | $0 |
| 2016 | $1,238 | $15,976 | $0 | $0 |
| 2015 | $1,178 | $15,976 | $0 | $0 |
| 2014 | -- | $9,775 | $0 | $0 |
| 2013 | -- | $12,280 | $0 | $0 |
Source: Public Records
Map
Nearby Homes
- 11621 E Ada Place
- 809 S Nome St
- 811 S Macon Way
- 841 S Oakland St
- 906 S Moline St
- 607 S Oswego Ct
- 11623 E Virginia Dr
- 11973 E Kepner Dr
- 11955 E Ford Dr
- 11945 E Ford Dr
- 11996 E Kepner Dr
- 11812 E Alaska Ave
- 12055 E Tennessee Ave
- 912 S Peoria St
- 11931 E Tennessee Ave
- 11911 E Tennessee Ave
- 11759 E Alaska Ave
- 12161 E Center Dr
- 12093 E Hoye Dr
- 932 S Peoria St Unit 932
- 765 S Nile Way
- 745 S Nile Way
- 733 S Newark Ct
- 775 S Nile Way
- 735 S Nile Way
- 724 S Newark Ct
- 766 S Nile Way
- 11600 E Walsh Place
- 774 S Nile Way
- 742 S Moline St
- 723 S Newark Ct
- 785 S Nile Way
- 11609 E Walsh Place
- 725 S Nile Way
- 776 S Nile Way
- 732 S Moline St
- 714 S Newark Ct
- 786 S Nile Way
- 11610 E Walsh Place
- 11559 E Ada Place