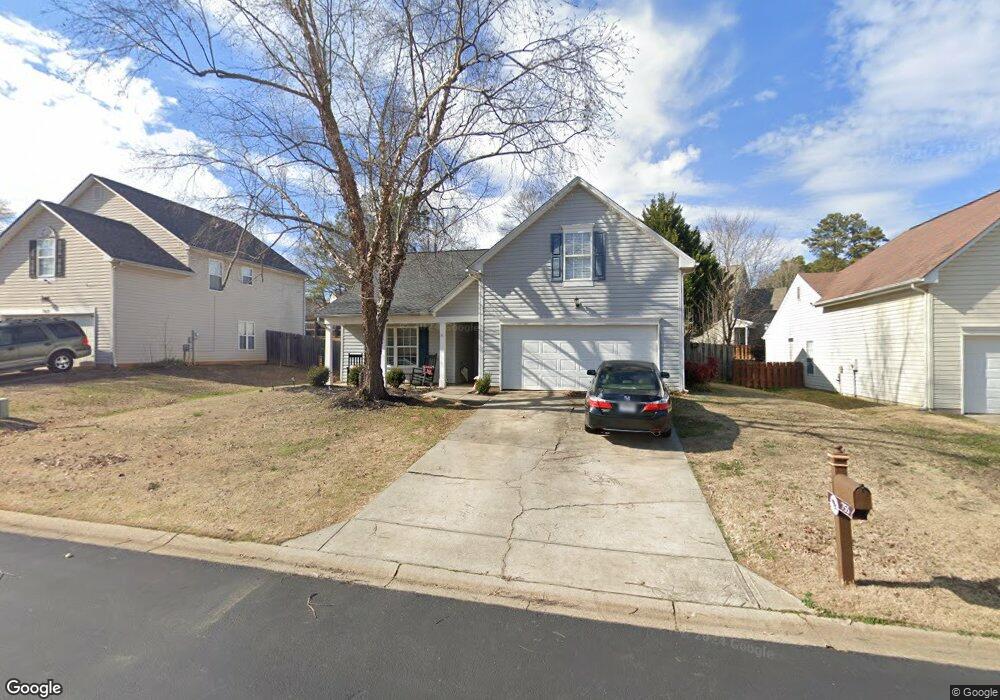
755 Thornbird Cir Boiling Springs, SC 29316
Estimated Value: $240,000 - $269,000
3
Beds
2
Baths
1,577
Sq Ft
$159/Sq Ft
Est. Value
About This Home
This home is located at 755 Thornbird Cir, Boiling Springs, SC 29316 and is currently estimated at $250,253, approximately $158 per square foot. 755 Thornbird Cir is a home located in Spartanburg County with nearby schools including Boiling Springs Elementary School, Rainbow Lake Middle School, and Boiling Springs High School.
Ownership History
Date
Name
Owned For
Owner Type
Purchase Details
Closed on
Sep 30, 2025
Sold by
Whitehouse Shannon Leigh and Whitehouse-Klocko Shannon L
Bought by
Whitehouse-Klocko Shannon L and Klocko Scott
Current Estimated Value
Purchase Details
Closed on
Mar 26, 2014
Sold by
The United States Department Of Housing
Bought by
Whitehouse Shannon Leigh
Home Financials for this Owner
Home Financials are based on the most recent Mortgage that was taken out on this home.
Original Mortgage
$90,824
Interest Rate
4.4%
Mortgage Type
FHA
Purchase Details
Closed on
Nov 22, 2013
Sold by
Hawkins Gayle C
Bought by
Secretary Of Housing & Urban Development
Purchase Details
Closed on
Nov 17, 2006
Sold by
Vaughn Tara Nichole and Kyle Tara Nichole Vaughn
Bought by
Hawkins Gayle C
Home Financials for this Owner
Home Financials are based on the most recent Mortgage that was taken out on this home.
Original Mortgage
$127,000
Interest Rate
6.33%
Mortgage Type
New Conventional
Purchase Details
Closed on
Sep 30, 2003
Sold by
Collins Cardenal M
Bought by
Vaughn Tara Nichole
Create a Home Valuation Report for This Property
The Home Valuation Report is an in-depth analysis detailing your home's value as well as a comparison with similar homes in the area
Home Values in the Area
Average Home Value in this Area
Purchase History
| Date | Buyer | Sale Price | Title Company |
|---|---|---|---|
| Whitehouse-Klocko Shannon L | -- | Amt Title Services | |
| Whitehouse Shannon Leigh | $92,500 | -- | |
| Secretary Of Housing & Urban Development | $84,320 | -- | |
| Hawkins Gayle C | $127,000 | None Available | |
| Vaughn Tara Nichole | $106,000 | -- |
Source: Public Records
Mortgage History
| Date | Status | Borrower | Loan Amount |
|---|---|---|---|
| Previous Owner | Whitehouse Shannon Leigh | $90,824 | |
| Previous Owner | Hawkins Gayle C | $127,000 |
Source: Public Records
Tax History Compared to Growth
Tax History
| Year | Tax Paid | Tax Assessment Tax Assessment Total Assessment is a certain percentage of the fair market value that is determined by local assessors to be the total taxable value of land and additions on the property. | Land | Improvement |
|---|---|---|---|---|
| 2025 | $1,098 | $6,385 | $952 | $5,433 |
| 2024 | $1,098 | $6,385 | $952 | $5,433 |
| 2023 | $1,098 | $6,385 | $952 | $5,433 |
| 2022 | $978 | $5,552 | $737 | $4,815 |
| 2021 | $976 | $5,552 | $737 | $4,815 |
| 2020 | $961 | $5,552 | $737 | $4,815 |
| 2019 | $961 | $5,552 | $737 | $4,815 |
| 2018 | $938 | $5,552 | $737 | $4,815 |
| 2017 | $828 | $4,828 | $780 | $4,048 |
| 2016 | $833 | $4,828 | $780 | $4,048 |
| 2015 | $2,652 | $7,242 | $1,170 | $6,072 |
| 2014 | $2,635 | $7,242 | $1,170 | $6,072 |
Source: Public Records
Map
Nearby Homes
- 125 Condor Place
- 5082 Sunnycreek Dr
- 5085 Sunnycreek Dr
- 5086 Sunnycreek Dr
- 5090 Sunnycreek Dr
- 5077 Sunnycreek Dr
- 5081 Sunnycreek Dr
- 864 Thornbird Cir
- 242 Birds Eye View
- 133 Valley Creek Dr
- Crestfall II Plan at Hazelwood
- Glenwood II Plan at Hazelwood
- Laurel II Plan at Hazelwood
- Bentcreek II Plan at Hazelwood
- Hidden Creek II Plan at Hazelwood
- 517 Tilgate Ct
- 0 Cecelia Drive - Lot 1
- 808 Cecelia Dr
- 775 Overton Ridge Way
- 652 Clarion Ct
- 749 Thornbird Cir
- 761 Thornbird Cir
- 115 Condor Place
- 739 Thornbird Cir
- 754 Thornbird Cir
- 760 Thornbird Cir
- 748 Thornbird Cir
- 709 Thornbird Cir
- 773 Thornbird Cir
- 723 Thornbird Cir
- 715 Thornbird Cir
- 703 Thornbird Cir
- 766 Thornbird Cir
- 742 Thornbird Cir
- 126 Condor Place
- 116 Condor Place
- 697 Thornbird Cir
- 779 Thornbird Cir
- 772 Thornbird Cir
- 736 Thornbird Cir