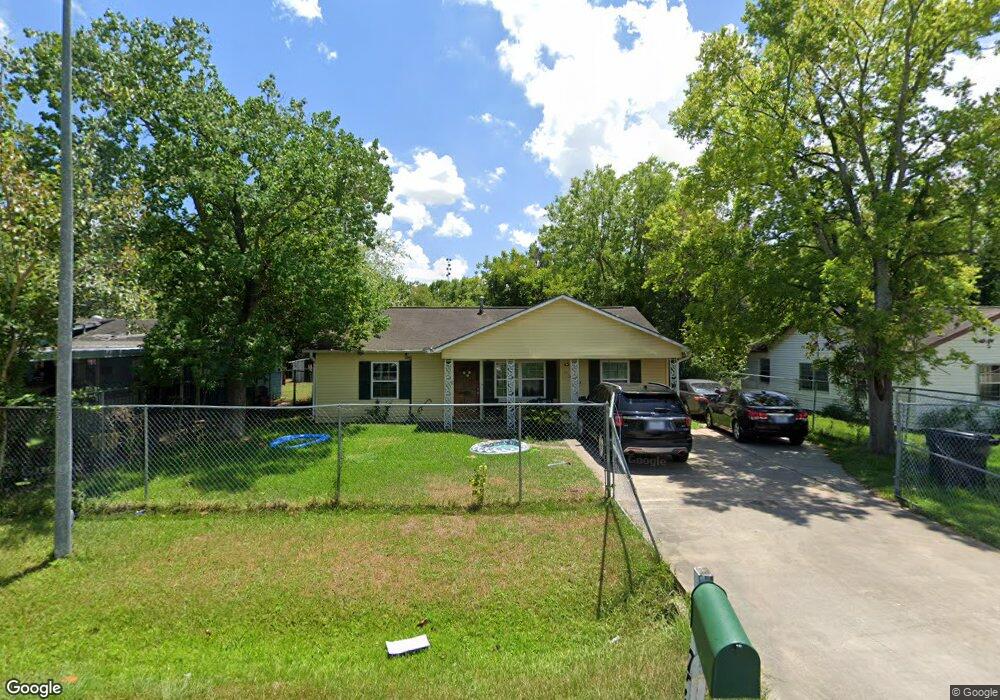
7550 Delavan Dr Houston, TX 77028
Trinity-Houston Gardens NeighborhoodEstimated Value: $155,422 - $181,000
3
Beds
1
Bath
1,176
Sq Ft
$142/Sq Ft
Est. Value
About This Home
This home is located at 7550 Delavan Dr, Houston, TX 77028 and is currently estimated at $166,606, approximately $141 per square foot. 7550 Delavan Dr is a home located in Harris County with nearby schools including McGowen Elementary School, Key Middle, and Kashmere High School.
Ownership History
Date
Name
Owned For
Owner Type
Purchase Details
Closed on
Dec 13, 2019
Sold by
Hooten Yesenia Vaca
Bought by
Vaca Leonel and Mendez Vaca Consuelo Irais
Current Estimated Value
Purchase Details
Closed on
Mar 15, 2005
Sold by
Vaca Leonel and Vaca Rosita G
Bought by
Vaca Yesenia
Purchase Details
Closed on
Aug 10, 1999
Sold by
Hud
Bought by
Vaca Leonel and Vaca Rosita G
Purchase Details
Closed on
Dec 1, 1998
Sold by
Aurora Loan Services Inc
Bought by
Hud
Purchase Details
Closed on
Aug 31, 1994
Sold by
Kyle Nathanial T and Kyle Patricia A
Bought by
Gooden Alex M and Gooden Evone Kyles
Home Financials for this Owner
Home Financials are based on the most recent Mortgage that was taken out on this home.
Original Mortgage
$29,984
Interest Rate
8.46%
Mortgage Type
FHA
Create a Home Valuation Report for This Property
The Home Valuation Report is an in-depth analysis detailing your home's value as well as a comparison with similar homes in the area
Home Values in the Area
Average Home Value in this Area
Purchase History
| Date | Buyer | Sale Price | Title Company |
|---|---|---|---|
| Vaca Leonel | -- | None Available | |
| Vaca Yesenia | -- | -- | |
| Vaca Leonel | -- | Fidelity National Title | |
| Hud | -- | -- | |
| Aurora Loan Services Inc | $32,010 | -- | |
| Gooden Alex M | -- | -- |
Source: Public Records
Mortgage History
| Date | Status | Borrower | Loan Amount |
|---|---|---|---|
| Previous Owner | Gooden Alex M | $29,984 |
Source: Public Records
Tax History Compared to Growth
Tax History
| Year | Tax Paid | Tax Assessment Tax Assessment Total Assessment is a certain percentage of the fair market value that is determined by local assessors to be the total taxable value of land and additions on the property. | Land | Improvement |
|---|---|---|---|---|
| 2025 | $3,047 | $162,350 | $51,039 | $111,311 |
| 2024 | $3,047 | $145,645 | $43,748 | $101,897 |
| 2023 | $3,047 | $134,708 | $32,811 | $101,897 |
| 2022 | $2,578 | $117,100 | $32,811 | $84,289 |
| 2021 | $2,379 | $102,059 | $21,874 | $80,185 |
| 2020 | $2,018 | $83,350 | $14,583 | $68,767 |
| 2019 | $1,839 | $72,667 | $14,583 | $58,084 |
| 2018 | $1,582 | $62,520 | $14,583 | $47,937 |
| 2017 | $1,581 | $62,520 | $14,583 | $47,937 |
| 2016 | $1,581 | $62,520 | $14,583 | $47,937 |
| 2015 | $1,231 | $62,520 | $14,583 | $47,937 |
| 2014 | $1,231 | $47,903 | $14,583 | $33,320 |
Source: Public Records
Map
Nearby Homes
- 7622 Delavan Dr
- 7546 Delavan Dr
- 7617 Ley Rd
- 7625 W Knoll St
- 7502 Ley Rd
- 7429 W Knoll St
- 7546 Bywood St
- 7538 Bywood St
- 7327 Ley Rd
- 7526 Bywood St
- 7832 Dewitt Rd
- 7325 Ley Rd
- 7413 W Knoll St
- 7502 Bywood St
- 7610 Touchstone St
- 7625 Touchstone St
- 7838 Carolwood Dr
- 7309 Orville St
- 7307 W Knoll St
- 7842 Linda Vista Rd
- 7602 Delavan Dr
- 7606 Delavan Dr
- 0 NE Corner Winship & Center Unit EV16121173
- 7610 Delavan Dr
- 7601 Delavan Dr
- 7551 Delavan Dr
- 7525 Ley Rd
- 7609 Delavan Dr
- 7614 Delavan Dr
- 7613 Delavan Dr
- 7520 Orville St
- 7617 Delavan Dr
- 7618 Delavan Dr
- 7550 Carothers St
- 7518 Orville St
- 7602 Carothers St
- 7546 Carothers St
- 7606 Carothers St
- 7621 Delavan Dr
- 7610 Carothers St