7551 Old Jessup Rd Jessup, MD 20794
Estimated Value: $3,061,108
--
Bed
--
Bath
11,220
Sq Ft
$273/Sq Ft
Est. Value
About This Home
This home is located at 7551 Old Jessup Rd, Jessup, MD 20794 and is currently priced at $3,061,108, approximately $272 per square foot. 7551 Old Jessup Rd is a home located in Anne Arundel County with nearby schools including Jessup Elementary School, Meade Middle School, and Meade High School.
Ownership History
Date
Name
Owned For
Owner Type
Purchase Details
Closed on
Sep 28, 2023
Sold by
Bardon Inc
Bought by
Iv3 Dorsey Run Logistics Center Llc
Current Estimated Value
Purchase Details
Closed on
Jul 26, 2023
Sold by
Tri M Properties Llc
Bought by
Iv3 Dorsey Run Logistics Center Llc
Purchase Details
Closed on
Feb 5, 2014
Sold by
Cinder & Concrete Block Corporation
Bought by
Tri M Properties Llc
Purchase Details
Closed on
Jun 10, 1985
Bought by
Cinder & Concrete Bl Corp
Home Financials for this Owner
Home Financials are based on the most recent Mortgage that was taken out on this home.
Original Mortgage
$881,900
Interest Rate
12.39%
Create a Home Valuation Report for This Property
The Home Valuation Report is an in-depth analysis detailing your home's value as well as a comparison with similar homes in the area
Home Values in the Area
Average Home Value in this Area
Purchase History
| Date | Buyer | Sale Price | Title Company |
|---|---|---|---|
| Iv3 Dorsey Run Logistics Center Llc | -- | None Listed On Document | |
| Iv3 Dorsey Run Logistics Center Llc | $15,000,000 | Stewart Title Guaranty Company | |
| Iv3 Dorsey Run Logistics Center Llc | -- | Stewart Title Guaranty Company | |
| Iv3 Dorsey Run Logistics Center Llc | -- | Stewart Title Guaranty Company | |
| Tri M Properties Llc | $2,000,000 | Allview Title Group | |
| Cinder & Concrete Bl Corp | $295,800 | -- |
Source: Public Records
Mortgage History
| Date | Status | Borrower | Loan Amount |
|---|---|---|---|
| Previous Owner | Cinder & Concrete Bl Corp | $881,900 |
Source: Public Records
Tax History Compared to Growth
Tax History
| Year | Tax Paid | Tax Assessment Tax Assessment Total Assessment is a certain percentage of the fair market value that is determined by local assessors to be the total taxable value of land and additions on the property. | Land | Improvement |
|---|---|---|---|---|
| 2025 | $28,079 | $2,051,400 | $1,155,200 | $896,200 |
| 2024 | $28,079 | $2,051,400 | $1,155,200 | $896,200 |
| 2023 | $28,002 | $2,051,400 | $1,155,200 | $896,200 |
| 2022 | $27,093 | $2,074,100 | $1,155,200 | $918,900 |
| 2021 | $53,832 | $2,060,567 | $0 | $0 |
| 2020 | $26,765 | $2,047,033 | $0 | $0 |
| 2019 | $26,613 | $2,033,500 | $1,145,200 | $888,300 |
| 2018 | $18,195 | $1,794,367 | $0 | $0 |
| 2017 | $19,810 | $1,555,233 | $0 | $0 |
| 2016 | -- | $1,316,100 | $0 | $0 |
| 2015 | -- | $1,236,700 | $0 | $0 |
| 2014 | -- | $1,157,300 | $0 | $0 |
Source: Public Records
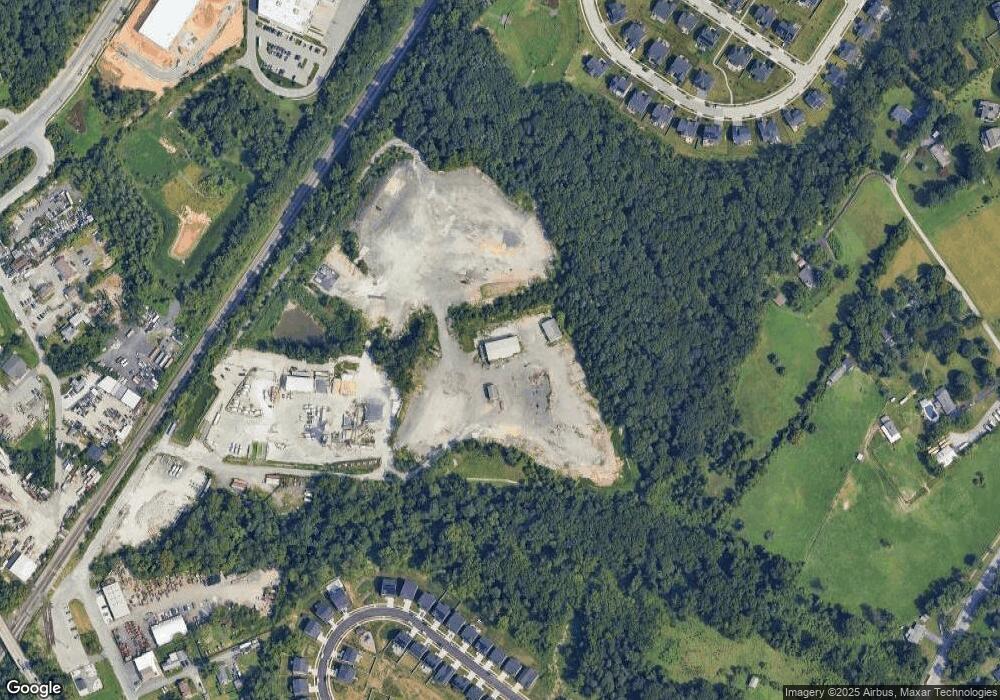
Map
Nearby Homes
- 2357 Terrapin Crossing
- 2044 Orchard Ave
- 7320 Elbridge Ct
- 8353 Ashwood Rd Unit 8353
- 8304 Firewood Ct
- 0 Simms Ln
- 7951 Silver Oak Rd
- 8281 Washington Blvd
- 7926 Silver Oak Rd
- 2727 Amber Crest Rd
- 7328 Wisteria Point Dr
- 7417 Copper Lake Dr
- 7405 Copper Lake Dr
- 0007 Copperleaf Blvd
- 0004 Copperleaf Blvd
- 7407 Copper Lake Dr
- 0003 Copperleaf Blvd
- 2642 Shade Branch Rd
- Lot 7 Cedar Ave
- 0006 Copperleaf Blvd
- 7559 Old Jessup Rd
- 8001 Old Jessup Rd
- 2375 Terrapin Crossing
- 2377 Terrapin Crossing
- 2373 Terrapin Crossing
- 2379 Terrapin Crossing
- 2381 Terrapin Crossing
- 7538 Arundel Woods Dr
- 7536 Arundel Woods Dr
- 7540 Arundel Woods Dr
- 7534 Arundel Woods Dr
- 2383 Terrapin Crossing
- 7532 Arundel Woods Dr
- 2385 Terrapin Crossing
- 7542 Arundel Woods Dr
- 2369 Terrapin Crossing
- 2387 Terrapin Crossing
- 2376 Terrapin Crossing
- 2077 Shipley Farm Rd
- 2378 Terrapin Crossing