Estimated Value: $1,645,000 - $2,601,000
5
Beds
6
Baths
6,848
Sq Ft
$295/Sq Ft
Est. Value
About This Home
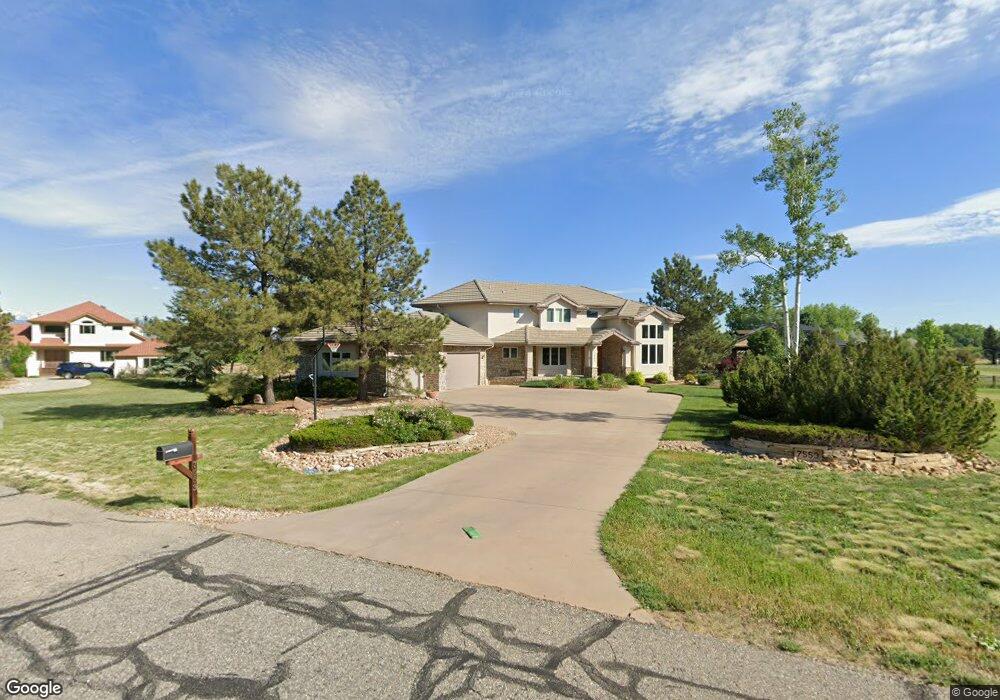
This home is located at 7553 Crestview Dr, Niwot, CO 80504 and is currently estimated at $2,022,399, approximately $295 per square foot. 7553 Crestview Dr is a home located in Boulder County with nearby schools including Niwot Elementary School, Sunset Middle School, and Niwot High School.
Ownership History
Date
Name
Owned For
Owner Type
Purchase Details
Closed on
May 4, 2012
Sold by
Storz Peter K and Storz Carolyn P S
Bought by
Vertuca Carl R
Current Estimated Value
Home Financials for this Owner
Home Financials are based on the most recent Mortgage that was taken out on this home.
Original Mortgage
$624,000
Outstanding Balance
$429,284
Interest Rate
3.75%
Mortgage Type
Adjustable Rate Mortgage/ARM
Estimated Equity
$1,593,115
Purchase Details
Closed on
Dec 26, 2002
Sold by
Storz J Peter K and Storz Carolyn P S
Bought by
Storz J Peter K
Purchase Details
Closed on
Dec 24, 1996
Sold by
Shaub Enterprises Inc
Bought by
Storz J Peter K
Home Financials for this Owner
Home Financials are based on the most recent Mortgage that was taken out on this home.
Original Mortgage
$470,400
Interest Rate
7.37%
Purchase Details
Closed on
Feb 16, 1996
Sold by
Murakami Lesley Jonathan
Bought by
Shaub Enterprises Inc
Create a Home Valuation Report for This Property
The Home Valuation Report is an in-depth analysis detailing your home's value as well as a comparison with similar homes in the area
Home Values in the Area
Average Home Value in this Area
Purchase History
| Date | Buyer | Sale Price | Title Company |
|---|---|---|---|
| Vertuca Carl R | $780,000 | Land Title Guarantee Company | |
| Storz J Peter K | -- | -- | |
| Storz J Peter K | $588,000 | -- | |
| Shaub Enterprises Inc | $109,900 | -- |
Source: Public Records
Mortgage History
| Date | Status | Borrower | Loan Amount |
|---|---|---|---|
| Open | Vertuca Carl R | $624,000 | |
| Previous Owner | Storz J Peter K | $470,400 |
Source: Public Records
Tax History Compared to Growth
Tax History
| Year | Tax Paid | Tax Assessment Tax Assessment Total Assessment is a certain percentage of the fair market value that is determined by local assessors to be the total taxable value of land and additions on the property. | Land | Improvement |
|---|---|---|---|---|
| 2025 | $11,482 | $111,063 | $29,619 | $81,444 |
| 2024 | $11,482 | $111,063 | $29,619 | $81,444 |
| 2023 | $11,331 | $116,258 | $16,985 | $102,959 |
| 2022 | $9,371 | $91,747 | $15,075 | $76,672 |
| 2021 | $9,496 | $94,387 | $15,508 | $78,879 |
| 2020 | $7,524 | $74,939 | $15,015 | $59,924 |
| 2019 | $7,407 | $74,939 | $15,015 | $59,924 |
| 2018 | $6,926 | $70,502 | $14,112 | $56,390 |
| 2017 | $6,518 | $77,945 | $15,602 | $62,343 |
| 2016 | $6,799 | $72,070 | $16,000 | $56,070 |
| 2015 | $6,475 | $66,354 | $23,800 | $42,554 |
| 2014 | $6,700 | $66,354 | $23,800 | $42,554 |
Source: Public Records
Map
Nearby Homes
- 7735 Crestview Ln
- 7785 Darvey Ln
- 9258 Niwot Hills Dr
- 9260 Shooting Star Ct
- 9261 Blue Spruce Ln
- 6695 Blazing Star Ct
- 7220 Spring Creek Cir
- 8896 Niwot Rd
- 7204 Spring Creek Cir
- 8840 Niwot Rd
- 8942 Comanche Rd
- 8836 Marathon Rd
- 10515 Mooring Rd
- 2425 Water Cress Ct
- 2237 Eagleview Way
- 2443 Mallard Cir
- 2284 Indian Peaks Cir
- 8576 Niwot Meadow Farm Rd
- 6668 Walker Ct
- 6557 Legend Ridge Trail
- 7539 Crestview Dr
- 7567 Crestview Dr
- 7589 Crestview Dr
- 7542 Crestview Dr
- 7556 Crestview Dr
- 7520 Crestview Dr
- 7525 Crestview Dr
- 7590 Crestview Dr
- 7562 Crestview Dr
- 9631 Majestic Rd
- 7586 Crestview Dr
- 7607 Crestview Dr
- 9685 Majestic Rd
- 7570 Crestview Dr
- 7602 Crestview Dr
- 7511 Crestview Dr
- 7566 Crestview Dr
- 0 Majestic Rd
- 9751 Majestic Rd
- 9666 Majestic Rd