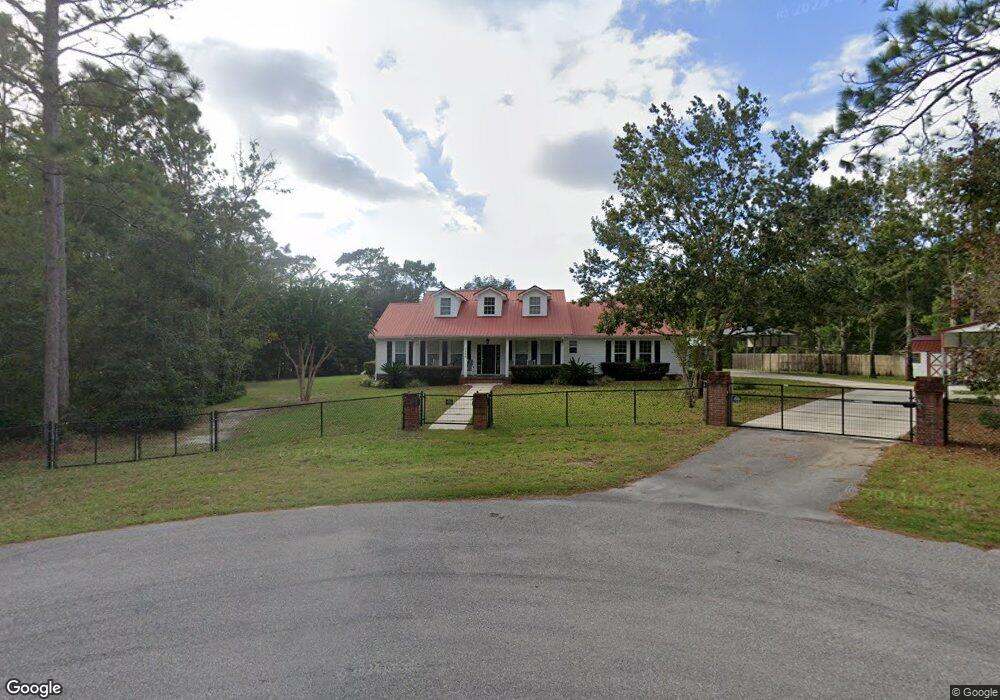
7558 Alameda Way Keystone Heights, FL 32656
Estimated Value: $483,000 - $528,841
4
Beds
3
Baths
2,501
Sq Ft
$202/Sq Ft
Est. Value
About This Home
This home is located at 7558 Alameda Way, Keystone Heights, FL 32656 and is currently estimated at $505,960, approximately $202 per square foot. 7558 Alameda Way is a home located in Clay County with nearby schools including Keystone Heights Elementary School, Keystone Heights Junior/Senior High School, and Morningstar Christian School.
Ownership History
Date
Name
Owned For
Owner Type
Purchase Details
Closed on
Oct 19, 2018
Sold by
Myer Michael M and Myer Kelly L
Bought by
Huntley Michael R and Huntley Jacqueline M
Current Estimated Value
Home Financials for this Owner
Home Financials are based on the most recent Mortgage that was taken out on this home.
Original Mortgage
$284,900
Outstanding Balance
$248,450
Interest Rate
4.5%
Mortgage Type
New Conventional
Estimated Equity
$257,510
Purchase Details
Closed on
May 24, 2017
Bought by
Myer Michael M
Home Financials for this Owner
Home Financials are based on the most recent Mortgage that was taken out on this home.
Original Mortgage
$300,600
Interest Rate
4.02%
Purchase Details
Closed on
Jul 10, 2002
Sold by
Richardson Construction Inc
Bought by
Myer Michael and Myer Kelly
Home Financials for this Owner
Home Financials are based on the most recent Mortgage that was taken out on this home.
Original Mortgage
$131,000
Interest Rate
6.16%
Create a Home Valuation Report for This Property
The Home Valuation Report is an in-depth analysis detailing your home's value as well as a comparison with similar homes in the area
Home Values in the Area
Average Home Value in this Area
Purchase History
| Date | Buyer | Sale Price | Title Company |
|---|---|---|---|
| Huntley Michael R | $299,900 | Attorney | |
| Myer Michael M | -- | -- | |
| Myer Michael | $15,000 | North Central Title Inc |
Source: Public Records
Mortgage History
| Date | Status | Borrower | Loan Amount |
|---|---|---|---|
| Open | Huntley Michael R | $284,900 | |
| Previous Owner | Myer Michael M | $300,600 | |
| Previous Owner | Myer Michael M | -- | |
| Previous Owner | Myer Michael | $131,000 |
Source: Public Records
Tax History Compared to Growth
Tax History
| Year | Tax Paid | Tax Assessment Tax Assessment Total Assessment is a certain percentage of the fair market value that is determined by local assessors to be the total taxable value of land and additions on the property. | Land | Improvement |
|---|---|---|---|---|
| 2024 | $3,844 | $279,411 | -- | -- |
| 2023 | $3,844 | $271,273 | $0 | $0 |
| 2022 | $3,618 | $263,372 | $0 | $0 |
| 2021 | $3,601 | $255,701 | $0 | $0 |
| 2020 | $3,225 | $235,689 | $0 | $0 |
| 2019 | $3,179 | $230,391 | $0 | $0 |
| 2018 | $2,204 | $176,448 | $0 | $0 |
| 2017 | $2,191 | $172,819 | $0 | $0 |
| 2016 | $2,187 | $169,264 | $0 | $0 |
| 2015 | $2,244 | $168,087 | $0 | $0 |
| 2014 | $2,144 | $163,886 | $0 | $0 |
Source: Public Records
Map
Nearby Homes
- 7557 Alameda Way
- 7569 Alameda Way
- 7218 Salem Dr
- 6044 Lehigh Cir
- 7575 Alameda Way
- 6128 Center Cir
- 7649 Casa Grande Blvd
- 7622 Alameda Way
- 00 Harvard Ave
- 7628 Alameda Way
- 6030 Harvard Ave
- 6099 Harvard Ave
- 7244 Lehigh Dr
- 7231 Lehigh Dr
- 7233 Lehigh Dr
- 6208 Hunter Ave
- 6160 Hunter Ave
- 6185 Cornell Rd
- 00 Cornell Rd
- 5781 S Crater Lake Cir
- 7566 Alameda Way
- 7465 Alameda Way
- 7267 Lehigh Dr
- 7221 Chipola Dr
- 7214 Salem Dr
- 7202 Salem Dr
- 7218 Chipola Dr
- 7222 Chipola Dr
- 7214 Chipola Dr
- 7622 Oak Dr
- 7612 Oak Dr
- 7583 Alameda Way
- 6014 County Road 214
- 7241 Lehigh Dr
- 7303 Lehigh Dr
- 7592 Alameda Way
- 7586 Alameda Way
- 7590 Alameda Way
- 7205 Salem Dr
- 7593 Alameda Way