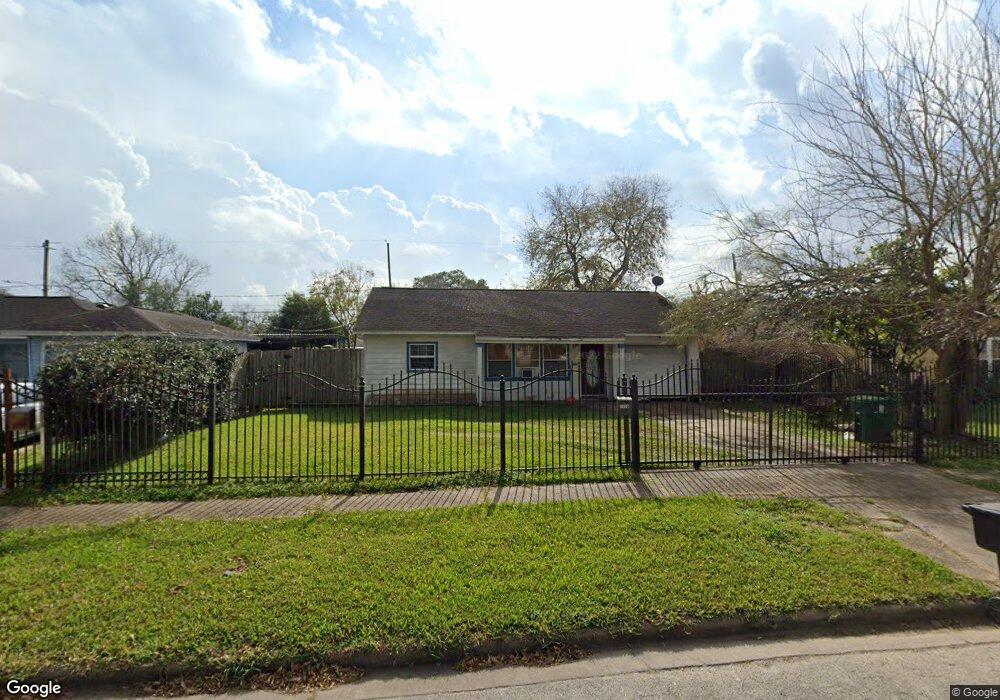
7558 El Rancho St Houston, TX 77087
Golfcrest-Bellfort-Reveille NeighborhoodEstimated Value: $163,913 - $214,000
3
Beds
1
Bath
1,030
Sq Ft
$179/Sq Ft
Est. Value
About This Home
This home is located at 7558 El Rancho St, Houston, TX 77087 and is currently estimated at $184,228, approximately $178 per square foot. 7558 El Rancho St is a home located in Harris County with nearby schools including Cornelius Elementary School, Hartman Middle School, and Ross Shaw Sterling Aviation High School.
Ownership History
Date
Name
Owned For
Owner Type
Purchase Details
Closed on
Jul 6, 2020
Sold by
Warwick Delbert L
Bought by
Garcia Raul
Current Estimated Value
Purchase Details
Closed on
Aug 3, 2019
Sold by
Garcia Esteban
Bought by
Garcia Raul
Purchase Details
Closed on
May 31, 2005
Sold by
Warwick Delbert L
Bought by
Garcia Esteban and Garcia Raul
Home Financials for this Owner
Home Financials are based on the most recent Mortgage that was taken out on this home.
Original Mortgage
$56,900
Interest Rate
7.5%
Mortgage Type
Seller Take Back
Purchase Details
Closed on
Nov 22, 2004
Sold by
Newton Deborah Warwick
Bought by
Warwick Delbert L
Purchase Details
Closed on
Dec 29, 2003
Sold by
Warwick Delbert L and Warwick Violette J
Bought by
Warwick Delbert L and Newton Deborah Warwick
Create a Home Valuation Report for This Property
The Home Valuation Report is an in-depth analysis detailing your home's value as well as a comparison with similar homes in the area
Home Values in the Area
Average Home Value in this Area
Purchase History
| Date | Buyer | Sale Price | Title Company |
|---|---|---|---|
| Garcia Raul | -- | Warwick Delbert L | |
| Garcia Raul | -- | None Available | |
| Garcia Raul | -- | None Available | |
| Garcia Esteban | $64,900 | -- | |
| Warwick Delbert L | -- | -- | |
| Warwick Delbert L | -- | -- |
Source: Public Records
Mortgage History
| Date | Status | Borrower | Loan Amount |
|---|---|---|---|
| Previous Owner | Garcia Esteban | $56,900 | |
| Closed | Garcia Raul | $0 |
Source: Public Records
Tax History Compared to Growth
Tax History
| Year | Tax Paid | Tax Assessment Tax Assessment Total Assessment is a certain percentage of the fair market value that is determined by local assessors to be the total taxable value of land and additions on the property. | Land | Improvement |
|---|---|---|---|---|
| 2025 | $3,262 | $160,787 | $58,844 | $101,943 |
| 2024 | $3,262 | $155,907 | $51,489 | $104,418 |
| 2023 | $3,262 | $155,907 | $51,489 | $104,418 |
| 2022 | $3,472 | $147,605 | $51,489 | $96,116 |
| 2021 | $2,730 | $117,136 | $29,422 | $87,714 |
| 2020 | $2,437 | $94,770 | $18,389 | $76,381 |
| 2019 | $2,356 | $87,900 | $18,389 | $69,511 |
| 2018 | $2,009 | $79,380 | $18,389 | $60,991 |
| 2017 | $2,126 | $79,380 | $18,389 | $60,991 |
| 2016 | $2,064 | $77,064 | $18,389 | $58,675 |
| 2015 | $1,699 | $73,166 | $16,550 | $56,616 |
| 2014 | $1,699 | $66,106 | $16,550 | $49,556 |
Source: Public Records
Map
Nearby Homes
- 7486 Stanwick Dr
- 6023 Winterhaven Dr
- 7819 Leonora St
- 7837 Leonora St
- 7734 El Rancho St
- 7735 Oak Vista St
- 7337 Moline St
- 7908 Grove Ridge Dr
- 7758 Hereford St
- 3731 Reveille St
- 7936 Grove Ridge Dr
- 7954 Grove Ridge Dr
- 7309 Moline St
- 7909 Dixie Dr
- 7355 Bellfort St
- 6046 Harbrook Dr
- 7543 Greenstone St
- 7507 Greenstone St
- 7546 Greendowns St
- 7659 Greenstone St
- 7554 El Rancho St
- 7562 El Rancho St
- 7551 Hereford St
- 7550 El Rancho St
- 7555 Hereford St
- 7547 Hereford St
- 7543 Hereford St
- 7546 El Rancho St
- 7559 El Rancho St
- 7563 El Rancho St
- 7555 El Rancho St
- 7539 Hereford St
- 7551 El Rancho St
- 7602 El Rancho St
- 7542 El Rancho St
- 7535 Hereford St
- 7603 Hereford St
- 7547 El Rancho St
- 7550 Hereford St
- 7546 Hereford St