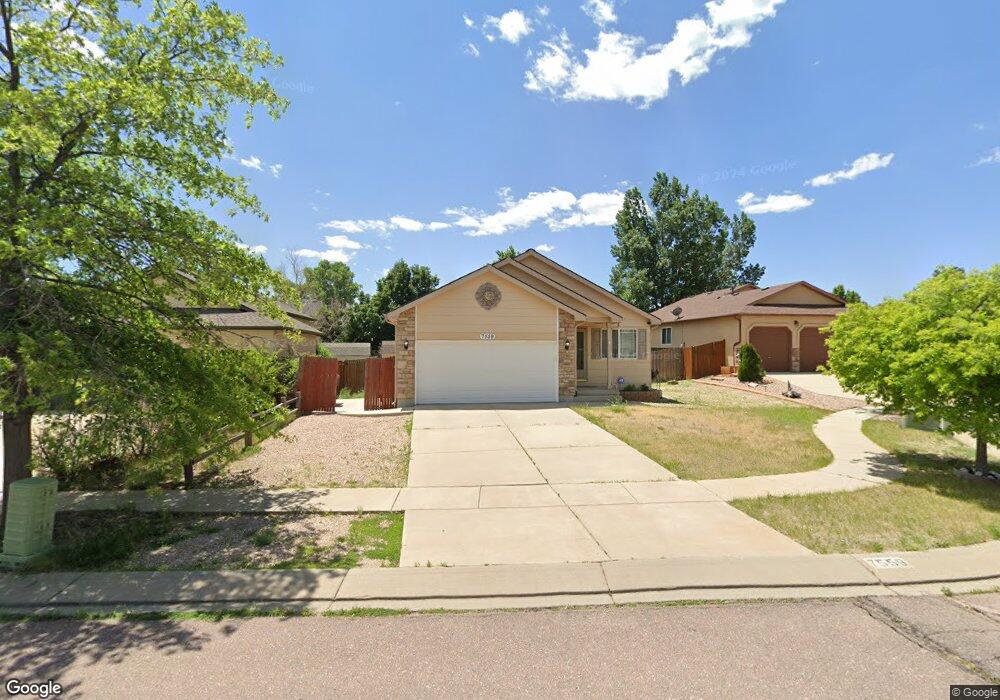
7559 Patina Ct Colorado Springs, CO 80922
Stetson Hills NeighborhoodEstimated Value: $389,896 - $441,000
2
Beds
2
Baths
1,016
Sq Ft
$408/Sq Ft
Est. Value
About This Home
This home is located at 7559 Patina Ct, Colorado Springs, CO 80922 and is currently estimated at $414,974, approximately $408 per square foot. 7559 Patina Ct is a home located in El Paso County with nearby schools including Stetson Elementary School, Skyview Middle School, and Vista Ridge High School.
Ownership History
Date
Name
Owned For
Owner Type
Purchase Details
Closed on
Jun 24, 2010
Sold by
Thrasher David L and Smith Brooke R
Bought by
Thrasher David L and Thrasher Brooke R
Current Estimated Value
Home Financials for this Owner
Home Financials are based on the most recent Mortgage that was taken out on this home.
Original Mortgage
$167,741
Outstanding Balance
$113,953
Interest Rate
5.25%
Mortgage Type
FHA
Estimated Equity
$301,021
Purchase Details
Closed on
Jun 3, 2003
Sold by
Gendron Homes Inc
Bought by
Thrasher David L and Smith Brooke R
Home Financials for this Owner
Home Financials are based on the most recent Mortgage that was taken out on this home.
Original Mortgage
$160,766
Interest Rate
5.65%
Mortgage Type
Unknown
Create a Home Valuation Report for This Property
The Home Valuation Report is an in-depth analysis detailing your home's value as well as a comparison with similar homes in the area
Home Values in the Area
Average Home Value in this Area
Purchase History
| Date | Buyer | Sale Price | Title Company |
|---|---|---|---|
| Thrasher David L | -- | Unified Title Company | |
| Thrasher David L | $163,300 | Stewart Title |
Source: Public Records
Mortgage History
| Date | Status | Borrower | Loan Amount |
|---|---|---|---|
| Open | Thrasher David L | $167,741 | |
| Closed | Thrasher David L | $160,766 |
Source: Public Records
Tax History Compared to Growth
Tax History
| Year | Tax Paid | Tax Assessment Tax Assessment Total Assessment is a certain percentage of the fair market value that is determined by local assessors to be the total taxable value of land and additions on the property. | Land | Improvement |
|---|---|---|---|---|
| 2025 | $1,509 | $29,230 | -- | -- |
| 2024 | $1,410 | $29,280 | $5,090 | $24,190 |
| 2023 | $1,410 | $29,280 | $5,090 | $24,190 |
| 2022 | $1,215 | $20,850 | $4,590 | $16,260 |
| 2021 | $1,267 | $21,450 | $4,720 | $16,730 |
| 2020 | $1,116 | $18,670 | $3,930 | $14,740 |
| 2019 | $1,104 | $18,670 | $3,930 | $14,740 |
| 2018 | $908 | $15,050 | $3,330 | $11,720 |
| 2017 | $913 | $15,050 | $3,330 | $11,720 |
| 2016 | $935 | $15,200 | $3,240 | $11,960 |
| 2015 | $936 | $15,200 | $3,240 | $11,960 |
| 2014 | $840 | $13,380 | $3,060 | $10,320 |
Source: Public Records
Map
Nearby Homes
- 7558 Patina Ct
- 4831 Desert Varnish Dr
- 5002 Sand Ripples Ln
- 4741 Falcons Hood Point
- 4721 Falcons Hood Point
- 4687 Pine Marten Point
- 8003 Steward Ln
- 7783 Autumn Leaf Way
- 4655 Vireos View
- 4661 Gray Fox Heights
- 7120 Highcroft Dr
- 4006 Gray Fox Heights
- 4620 Gray Fox Heights
- 4930 Townsend Dr
- 7723 Valley Quail Point
- 7659 Marmot Point
- 4632 Hidden River Dr
- 7578 Lost Pony Place
- 7711 Valley Quail Point
- 4031 Gray Fox Heights Unit 335
- 7577 Patina Ct
- 7541 Patina Ct
- 7490 Willowind Dr
- 7502 Willowind Dr
- 7466 Willowind Dr
- 7523 Patina Ct
- 7505 Patina Ct
- 7576 Patina Ct
- 7454 Willowind Dr
- 7540 Patina Ct
- 7504 Patina Ct
- 4819 Feathers Way
- 4811 Feathers Way
- 7522 Patina Ct
- 4827 Feathers Way
- 7442 Willowind Dr
- 4803 Feathers Way
- 4835 Feathers Way
- 4844 Feathers Way
- 4819 Desert Varnish Dr