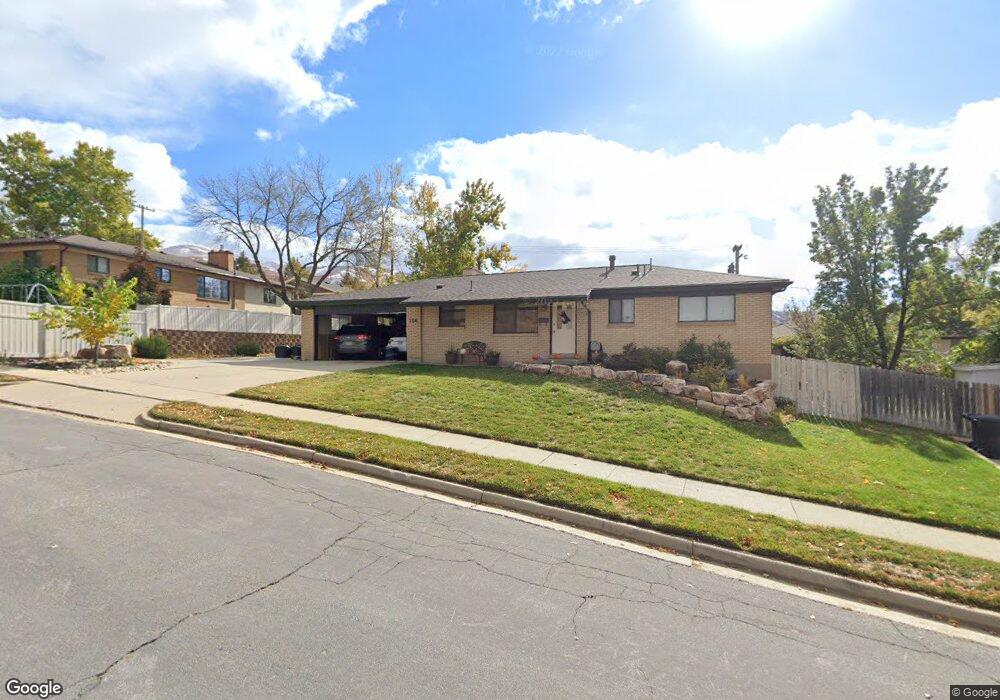
756 E 1850 S Bountiful, UT 84010
Estimated Value: $526,000 - $593,000
5
Beds
3
Baths
2,408
Sq Ft
$237/Sq Ft
Est. Value
About This Home
This home is located at 756 E 1850 S, Bountiful, UT 84010 and is currently estimated at $570,517, approximately $236 per square foot. 756 E 1850 S is a home located in Davis County with nearby schools including Muir School, Mueller Park Junior High School, and Bountiful High School.
Ownership History
Date
Name
Owned For
Owner Type
Purchase Details
Closed on
Jul 21, 2021
Sold by
Newbold Bradley M and Newbold Michelle F
Bought by
The Newbold Family Trust
Current Estimated Value
Purchase Details
Closed on
Nov 11, 2011
Sold by
Nilsen Matthew B and Nilsen Julie A
Bought by
Newbold Bradley M and Newbold Michelle F
Home Financials for this Owner
Home Financials are based on the most recent Mortgage that was taken out on this home.
Original Mortgage
$181,000
Interest Rate
3.87%
Mortgage Type
New Conventional
Purchase Details
Closed on
Jul 25, 2001
Sold by
Family Trust Of David D & Rita L Judd and Judd David D
Bought by
Nilsen Matthew B and Nilsen Julie A
Home Financials for this Owner
Home Financials are based on the most recent Mortgage that was taken out on this home.
Original Mortgage
$161,500
Interest Rate
7.15%
Create a Home Valuation Report for This Property
The Home Valuation Report is an in-depth analysis detailing your home's value as well as a comparison with similar homes in the area
Purchase History
| Date | Buyer | Sale Price | Title Company |
|---|---|---|---|
| The Newbold Family Trust | -- | None Available | |
| Newbold Bradley M | -- | First American Title | |
| Nilsen Matthew B | -- | Equity Title Agency |
Source: Public Records
Mortgage History
| Date | Status | Borrower | Loan Amount |
|---|---|---|---|
| Previous Owner | Newbold Bradley M | $181,000 | |
| Previous Owner | Nilsen Matthew B | $161,500 |
Source: Public Records
Tax History
| Year | Tax Paid | Tax Assessment Tax Assessment Total Assessment is a certain percentage of the fair market value that is determined by local assessors to be the total taxable value of land and additions on the property. | Land | Improvement |
|---|---|---|---|---|
| 2025 | $3,097 | $281,600 | $128,497 | $153,103 |
| 2024 | $2,981 | $281,600 | $118,555 | $163,045 |
| 2023 | $2,888 | $495,000 | $213,898 | $281,102 |
| 2022 | $3,019 | $284,350 | $113,751 | $170,599 |
| 2021 | $2,578 | $370,000 | $168,976 | $201,024 |
| 2020 | $2,286 | $329,000 | $153,886 | $175,114 |
| 2019 | $2,264 | $318,000 | $139,563 | $178,437 |
| 2018 | $2,108 | $291,000 | $136,785 | $154,215 |
| 2016 | $1,870 | $140,085 | $51,276 | $88,809 |
| 2015 | $1,837 | $129,910 | $51,276 | $78,634 |
| 2014 | $1,777 | $129,142 | $51,276 | $77,866 |
| 2013 | -- | $120,111 | $51,700 | $68,411 |
Source: Public Records
Map
Nearby Homes
- 1761 S Davis Blvd
- 631 E 1700 S
- 1886 S Jeri Dr
- 994 Deborah Dr
- 761 San Simeon Way
- 2059 S 350 E Unit 6
- 831 E San Simeon Way S
- 2053 S 350 E Unit 7
- 295 E 2050 S Unit 1
- 775 E 1500 S
- 2038 S 350 E Unit 3
- 1087 Arlington Way
- 2046 S 350 E Unit 4
- 795 Abby Ln Unit 5
- 296 E 2050 S Unit 2
- 320 E 2100 S
- 1888 S 1150 E
- 380 E 1500 S
- 288 E 1650 S
- 188 E 2050 S Unit D3
Your Personal Tour Guide
Ask me questions while you tour the home.