E
Seller's Agent in 2025
Ernest Palmer
William Raveis Real Estate
(732) 589-0471
7 in this area
50 Total Sales
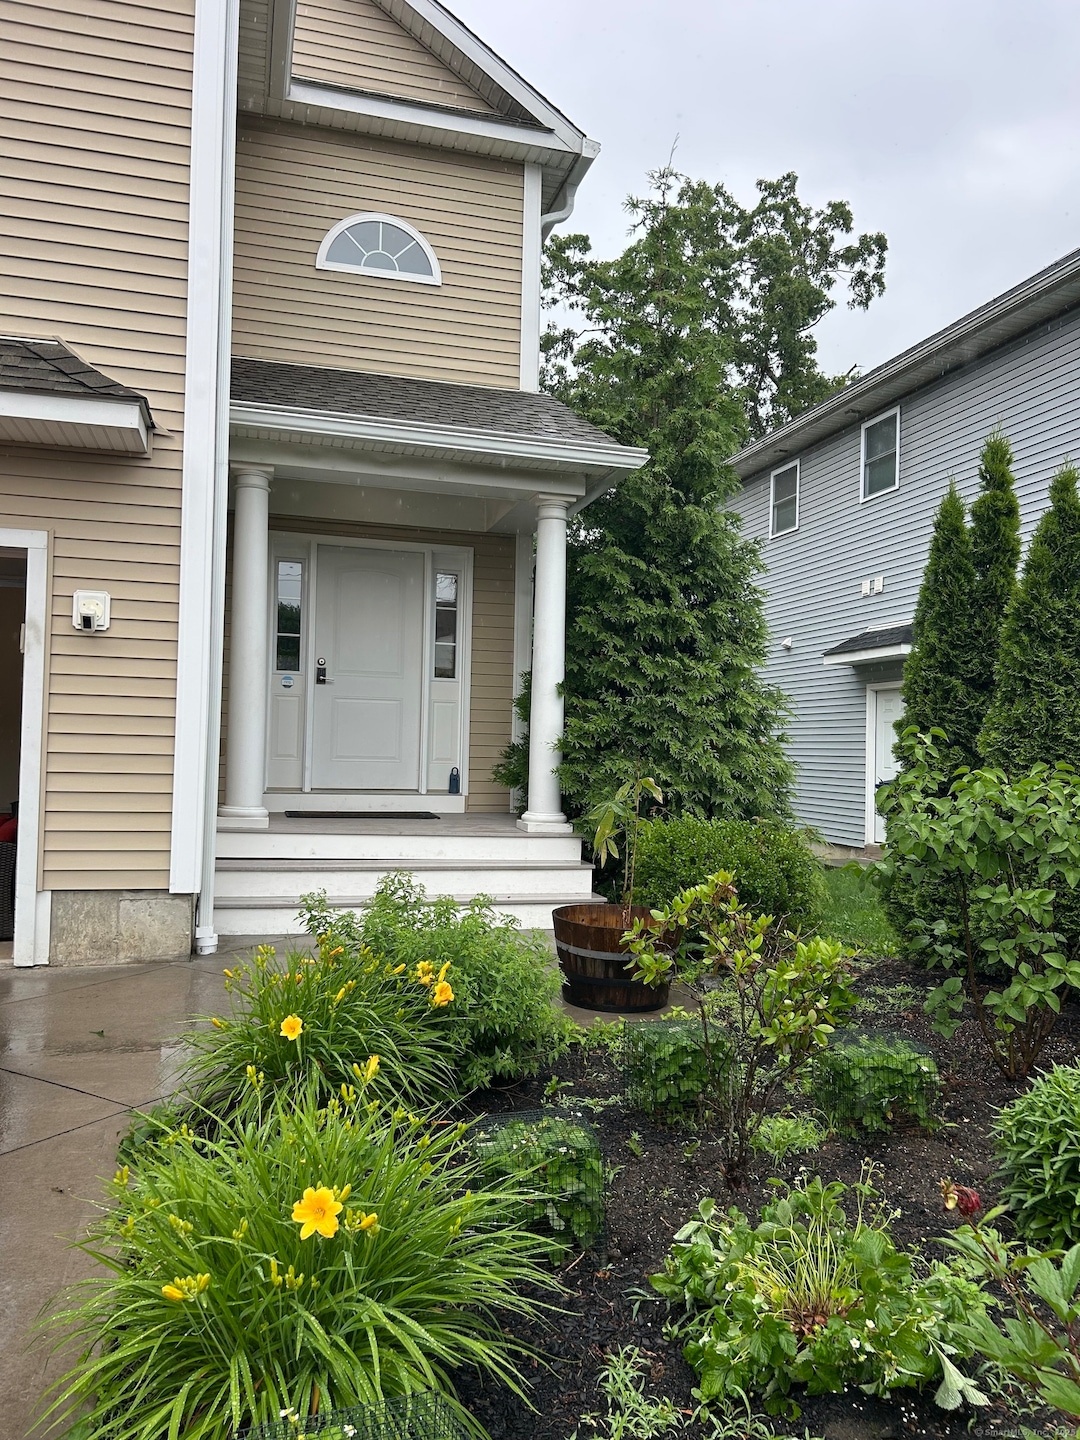
Very Nice home located on the North End In Bridgeport. This lovely well maintained home is located at the end of a Cul de Sac along a line of newer constructed homes within the last 5-6 years. This home features a large living space. The owner has lived in the home since it was orginally built and has taken a very active approach in keeping up with the home. The main floor offers a large eat in kitchen that is seperated by the main family room, which could possibly be opened to offer a complete open concept. Also the entrance to the kitche is connected to the garage which makes for those shopping trips to the grovery much more convenient. The upper level offers 3 well sized Guest bedrooms, also offering a Primary Bedroom with 2 large closets and full bathroom. also on thr Upper Level, has a Laundry room for easy convenience to wash/dry and fold clothes on the same level, along with a large walk in closet on the upper level for additional overflow storage. A full walk up attic provides for additional storage or the ability to create an additional entertainment space. Basement features a full walk out french doors with high ceilings, walks out to a padded back area that is perfect for relaxing and cactching some cool breeze. This home offers so many features that should not be missed.
Last Agent to Sell the Property
William Raveis Real Estate License #RES.0813265 Listed on: 06/10/2025

Last Buyer's Agent
William Raveis Real Estate License #RES.0813265 Listed on: 06/10/2025
| Date | Type | Sale Price | Title Company |
|---|---|---|---|
| Warranty Deed | $500,000 | -- | |
| Warranty Deed | -- | -- | |
| Warranty Deed | -- | -- | |
| Quit Claim Deed | -- | -- | |
| Quit Claim Deed | -- | -- | |
| Warranty Deed | $45,000 | -- | |
| Warranty Deed | $45,000 | -- | |
| Deed | $240,000 | -- | |
| Deed | $240,000 | -- |
| Date | Status | Loan Amount | Loan Type |
|---|---|---|---|
| Open | $384,615 | Future Advance Clause Open End Mortgage | |
| Previous Owner | $200,000 | No Value Available | |
| Previous Owner | $200,000 | Purchase Money Mortgage |
| Date | Event | Price | List to Sale | Price per Sq Ft |
|---|---|---|---|---|
| 07/30/2025 07/30/25 | Sold | $550,000 | 0.0% | $182 / Sq Ft |
| 06/12/2025 06/12/25 | For Sale | $550,000 | -- | $182 / Sq Ft |
| Year | Tax Paid | Tax Assessment Tax Assessment Total Assessment is a certain percentage of the fair market value that is determined by local assessors to be the total taxable value of land and additions on the property. | Land | Improvement |
|---|---|---|---|---|
| 2025 | $10,656 | $245,250 | $70,120 | $175,130 |
| 2024 | $10,656 | $245,250 | $70,120 | $175,130 |
| 2023 | $10,656 | $245,250 | $70,120 | $175,130 |
| 2022 | $10,656 | $245,250 | $70,120 | $175,130 |
| 2021 | $10,656 | $245,250 | $70,120 | $175,130 |
| 2020 | $10,955 | $202,900 | $42,490 | $160,410 |
| 2019 | $10,955 | $202,900 | $42,490 | $160,410 |
| 2018 | $11,032 | $202,900 | $42,490 | $160,410 |
| 2017 | $11,032 | $202,900 | $42,490 | $160,410 |
| 2016 | $11,032 | $202,900 | $42,490 | $160,410 |
| 2015 | $9,806 | $232,370 | $22,840 | $209,530 |
| 2014 | $9,806 | $232,370 | $22,840 | $209,530 |
E
Seller's Agent in 2025
Ernest Palmer
William Raveis Real Estate
(732) 589-0471
7 in this area
50 Total Sales
Source: SmartMLS
MLS Number: 24102879
APN: BRID-002433-000005
Disclaimer: Certain information contained herein is derived from information provided by parties other than Homes.com. All information provided is deemed reliable, but is not guaranteed to be accurate and should be independently verified.
![]() IDX information is provided exclusively for personal, non-commercial use, and may not be used for any purpose other than to identify prospective properties consumers may be interested in purchasing. Information is deemed reliable but not guaranteed.
IDX information is provided exclusively for personal, non-commercial use, and may not be used for any purpose other than to identify prospective properties consumers may be interested in purchasing. Information is deemed reliable but not guaranteed.