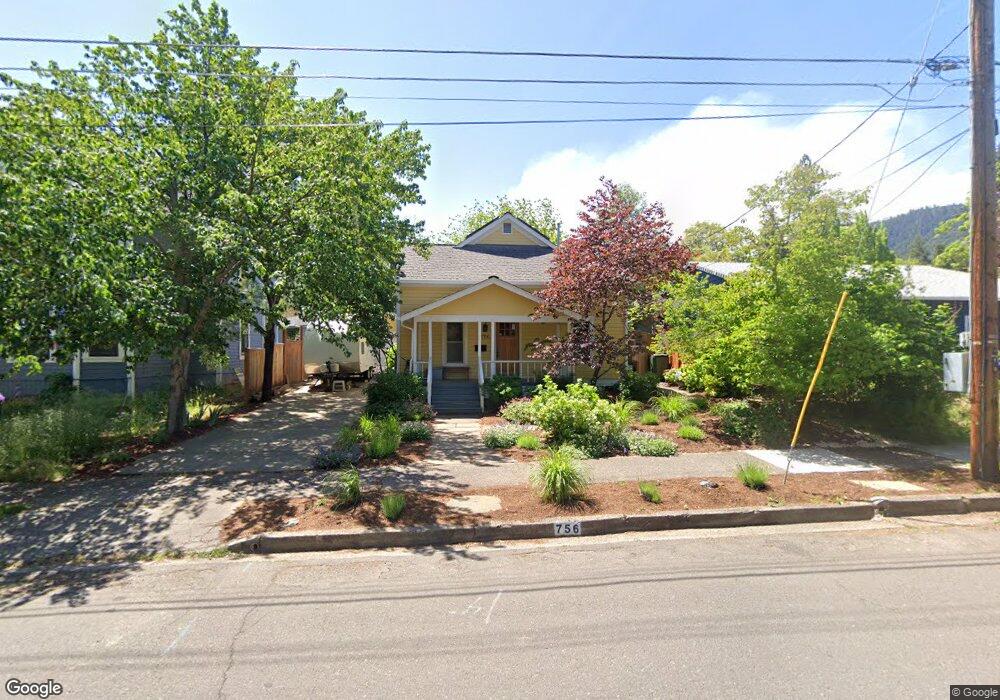
756 Iowa St Ashland, OR 97520
3 Tiers of Ashland NeighborhoodEstimated Value: $492,000 - $643,000
3
Beds
1
Bath
1,050
Sq Ft
$544/Sq Ft
Est. Value
About This Home
This home is located at 756 Iowa St, Ashland, OR 97520 and is currently estimated at $570,675, approximately $543 per square foot. 756 Iowa St is a home located in Jackson County with nearby schools including Walker Elementary School, Ashland Middle School, and Ashland High School.
Ownership History
Date
Name
Owned For
Owner Type
Purchase Details
Closed on
Jul 3, 2001
Sold by
Shanafelt Michael A
Bought by
Newman John Paul and Wilke Julie
Current Estimated Value
Home Financials for this Owner
Home Financials are based on the most recent Mortgage that was taken out on this home.
Original Mortgage
$120,000
Outstanding Balance
$46,581
Interest Rate
7.24%
Estimated Equity
$524,094
Purchase Details
Closed on
Sep 13, 1999
Sold by
Traver Emilie R
Bought by
Shanafelt Michael A
Create a Home Valuation Report for This Property
The Home Valuation Report is an in-depth analysis detailing your home's value as well as a comparison with similar homes in the area
Home Values in the Area
Average Home Value in this Area
Purchase History
| Date | Buyer | Sale Price | Title Company |
|---|---|---|---|
| Newman John Paul | $213,500 | Jackson County Title | |
| Shanafelt Michael A | $134,900 | Jackson County Title |
Source: Public Records
Mortgage History
| Date | Status | Borrower | Loan Amount |
|---|---|---|---|
| Open | Newman John Paul | $120,000 |
Source: Public Records
Tax History Compared to Growth
Tax History
| Year | Tax Paid | Tax Assessment Tax Assessment Total Assessment is a certain percentage of the fair market value that is determined by local assessors to be the total taxable value of land and additions on the property. | Land | Improvement |
|---|---|---|---|---|
| 2025 | $6,611 | $426,120 | $183,000 | $243,120 |
| 2024 | $6,611 | $429,310 | $141,620 | $287,690 |
| 2023 | $6,632 | $416,810 | $137,490 | $279,320 |
| 2022 | $6,420 | $416,810 | $137,490 | $279,320 |
| 2021 | $6,201 | $404,670 | $133,480 | $271,190 |
| 2020 | $6,027 | $392,890 | $129,590 | $263,300 |
| 2019 | $5,932 | $370,340 | $122,150 | $248,190 |
| 2018 | $5,603 | $359,560 | $118,590 | $240,970 |
| 2017 | $5,563 | $359,560 | $118,590 | $240,970 |
| 2016 | $5,418 | $338,930 | $111,780 | $227,150 |
| 2015 | $5,208 | $338,930 | $111,780 | $227,150 |
| 2014 | $5,039 | $319,480 | $105,370 | $214,110 |
Source: Public Records
Map
Nearby Homes