756 Nimblewill Creek Rd Dahlonega, GA 30533
Estimated Value: $308,113 - $423,000
--
Bed
2
Baths
1,146
Sq Ft
$337/Sq Ft
Est. Value
About This Home
This home is located at 756 Nimblewill Creek Rd, Dahlonega, GA 30533 and is currently estimated at $386,028, approximately $336 per square foot. 756 Nimblewill Creek Rd is a home located in Lumpkin County with nearby schools including Lumpkin County High School.
Ownership History
Date
Name
Owned For
Owner Type
Purchase Details
Closed on
Apr 14, 2017
Sold by
Jeffrey W
Bought by
Thomas Keith A and Thomas Cerena M
Current Estimated Value
Purchase Details
Closed on
Feb 2, 2016
Sold by
Jpmorgan Chase Bank
Bought by
Sec Of Veterans Affairs
Purchase Details
Closed on
Sep 5, 2013
Sold by
Thomas Keith A
Bought by
Thomas Wayne E
Home Financials for this Owner
Home Financials are based on the most recent Mortgage that was taken out on this home.
Original Mortgage
$184,320
Interest Rate
4.39%
Mortgage Type
VA
Purchase Details
Closed on
Nov 15, 2000
Sold by
Thomas Keith A
Bought by
Thomas Crena Marie
Purchase Details
Closed on
Nov 9, 2000
Sold by
Thomas Crena Marie
Bought by
Thomas Keith A and Thomas Cer
Purchase Details
Closed on
Feb 2, 1999
Sold by
Thomas Wayne E and Thomas Ver
Bought by
Thomas Keith A
Create a Home Valuation Report for This Property
The Home Valuation Report is an in-depth analysis detailing your home's value as well as a comparison with similar homes in the area
Home Values in the Area
Average Home Value in this Area
Purchase History
| Date | Buyer | Sale Price | Title Company |
|---|---|---|---|
| Thomas Keith A | -- | -- | |
| Sec Of Veterans Affairs | $151,290 | -- | |
| Jpmorgan Chase Bank | $151,290 | -- | |
| Thomas Wayne E | $180,000 | -- | |
| Thomas Crena Marie | -- | -- | |
| Thomas Keith A | -- | -- | |
| Thomas Keith A | -- | -- |
Source: Public Records
Mortgage History
| Date | Status | Borrower | Loan Amount |
|---|---|---|---|
| Previous Owner | Thomas Wayne E | $184,320 |
Source: Public Records
Tax History Compared to Growth
Tax History
| Year | Tax Paid | Tax Assessment Tax Assessment Total Assessment is a certain percentage of the fair market value that is determined by local assessors to be the total taxable value of land and additions on the property. | Land | Improvement |
|---|---|---|---|---|
| 2024 | $1,783 | $116,399 | $45,444 | $70,955 |
| 2023 | $1,278 | $111,696 | $45,444 | $66,252 |
| 2022 | $1,476 | $92,668 | $37,870 | $54,798 |
| 2021 | $1,288 | $83,466 | $37,870 | $45,596 |
| 2020 | $1,288 | $80,645 | $36,288 | $44,357 |
| 2019 | $1,298 | $80,645 | $36,288 | $44,357 |
| 2018 | $1,232 | $75,389 | $36,288 | $39,101 |
| 2017 | $2,126 | $73,510 | $36,288 | $37,222 |
| 2016 | $2,056 | $68,762 | $36,288 | $32,474 |
| 2015 | $948 | $68,762 | $36,288 | $32,474 |
| 2014 | $948 | $69,479 | $36,288 | $33,191 |
| 2013 | -- | $69,837 | $36,288 | $33,549 |
Source: Public Records
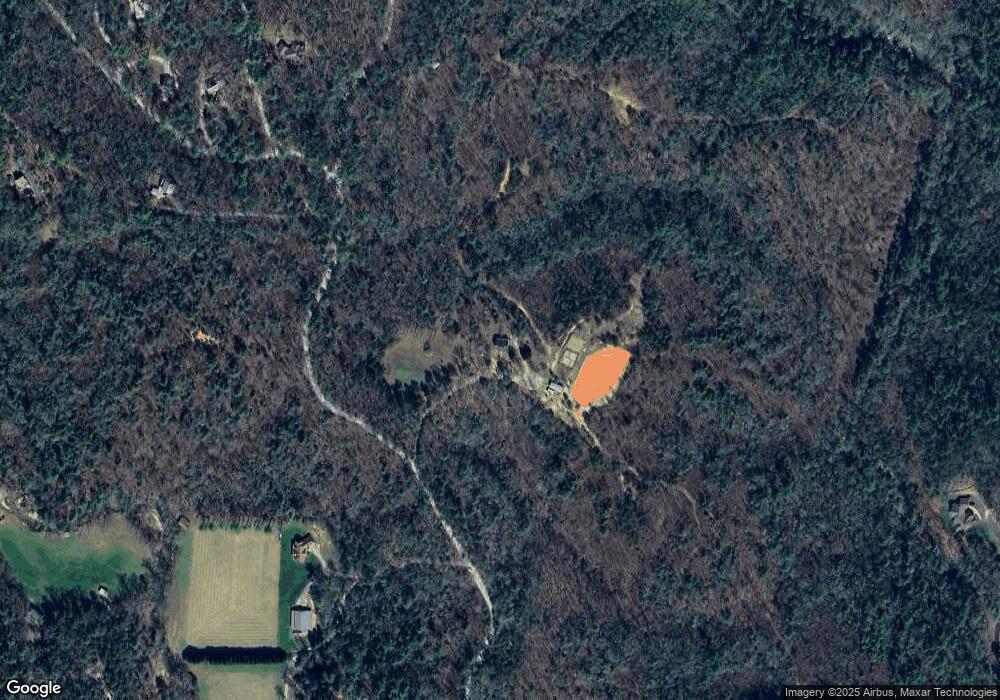
Map
Nearby Homes
- 687 Nimblewill Creek Rd
- 0 Nimblewill Creek Rd Unit 7592435
- 0 Nimblewill Creek Rd Unit 10537541
- 0 Nimblewill Creek Rd Unit 10537492
- 0 Nimblewill Creek Rd Unit 7592523
- 3A Patriot View Dr
- 1028 Jess Grizzle Rd
- 61 Station Gap
- 0 Via Senese Unit 10645153
- 0 Via Senese Unit 7682502
- 10 Strada Del Vino
- 0 Strada Del Vino Unit 10
- 9 W Woods Ct
- 235 W Woods Dr
- 604 Sheep Wallow Rd
- 245 W Woods Dr
- 155 Braeburn Ln
- 3050 Sheep Wallow Rd
- 160 Piazza Pomino
- 543 Rider Mill Rd
- Lot 10 Nimblewill Creek Rd
- Lot 46 Nimblewill Creek Rd
- Lot 48 Nimblewill Creek Rd
- Lot 47 Nimblewill Creek Rd
- Lot 38 Nimblewill Creek Rd
- Lot 1 Nimblewill Creek Rd
- Lot 43 Niblewill Creek Rd
- Lot 7 Niblewill Creek Rd
- Lot 51 Niblewill Creek Rd
- Lot 50 Niblewill Creek Rd
- 0 Avery Trail Unit 13 & 14 8348255
- 0 Avery Trail Unit 5984548
- 0 Avery Trail Unit 17 7457584
- 0 Avery Trail
- 0 Avery Trail Unit 8396106
- 0 Avery Trail Unit 8619990
- 0 Avery Trail Unit 17 8498845
- 0 Mackay Trail Unit 10 & 11 8685968
- 00 Mackay Trail
- 685 Nimblewill Creek Rd