Estimated Value: $272,000 - $291,274
3
Beds
2
Baths
1,289
Sq Ft
$218/Sq Ft
Est. Value
About This Home
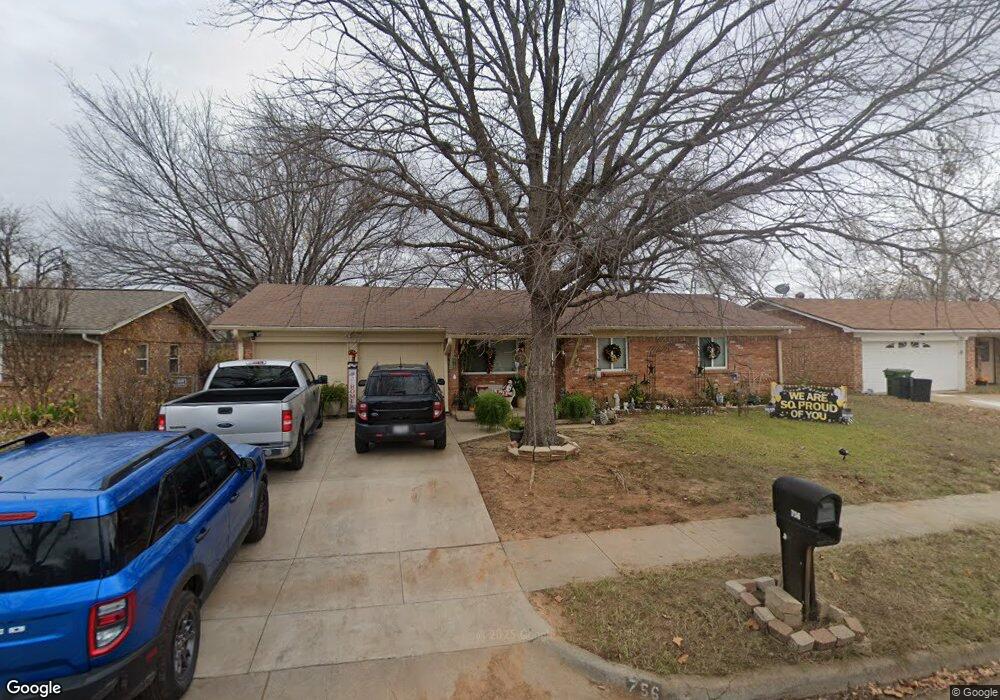
This home is located at 756 Oakwood Ave, Hurst, TX 76053 and is currently estimated at $281,319, approximately $218 per square foot. 756 Oakwood Ave is a home located in Tarrant County with nearby schools including West Hurst Elementary School, Hurst J High School, and L.D. Bell High School.
Ownership History
Date
Name
Owned For
Owner Type
Purchase Details
Closed on
Aug 21, 2019
Sold by
White Single Space Llc
Bought by
Hernandez Guadalupe and Hernandez Victor M
Current Estimated Value
Home Financials for this Owner
Home Financials are based on the most recent Mortgage that was taken out on this home.
Original Mortgage
$183,612
Outstanding Balance
$161,140
Interest Rate
3.8%
Mortgage Type
FHA
Estimated Equity
$120,180
Purchase Details
Closed on
Aug 27, 2018
Sold by
Myers The Home Buyers Of Dallas Llc
Bought by
White Single Space Llc
Purchase Details
Closed on
Aug 22, 2018
Sold by
Cavadian Properties Llc
Bought by
Myers The Home Buyers Of Dallas Llc
Purchase Details
Closed on
Aug 6, 2018
Sold by
Ford Carol F
Bought by
Cavadian Properties Llc
Create a Home Valuation Report for This Property
The Home Valuation Report is an in-depth analysis detailing your home's value as well as a comparison with similar homes in the area
Home Values in the Area
Average Home Value in this Area
Purchase History
| Date | Buyer | Sale Price | Title Company |
|---|---|---|---|
| Hernandez Guadalupe | -- | None Available | |
| White Single Space Llc | -- | None Available | |
| Myers The Home Buyers Of Dallas Llc | -- | None Available | |
| Cavadian Properties Llc | -- | Old Republic Title |
Source: Public Records
Mortgage History
| Date | Status | Borrower | Loan Amount |
|---|---|---|---|
| Open | Hernandez Guadalupe | $183,612 |
Source: Public Records
Tax History Compared to Growth
Tax History
| Year | Tax Paid | Tax Assessment Tax Assessment Total Assessment is a certain percentage of the fair market value that is determined by local assessors to be the total taxable value of land and additions on the property. | Land | Improvement |
|---|---|---|---|---|
| 2025 | $3,319 | $260,581 | $60,000 | $200,581 |
| 2024 | $3,319 | $260,581 | $60,000 | $200,581 |
| 2023 | $4,274 | $262,600 | $30,000 | $232,600 |
| 2022 | $4,466 | $218,913 | $30,000 | $188,913 |
| 2021 | $4,252 | $196,575 | $30,000 | $166,575 |
| 2020 | $3,856 | $160,286 | $30,000 | $130,286 |
| 2019 | $4,812 | $196,616 | $30,000 | $166,616 |
| 2018 | $1,098 | $172,498 | $18,000 | $154,498 |
| 2017 | $3,968 | $166,238 | $18,000 | $148,238 |
| 2016 | $3,608 | $152,876 | $18,000 | $134,876 |
| 2015 | $1,139 | $129,600 | $12,000 | $117,600 |
| 2014 | $1,139 | $129,600 | $12,000 | $117,600 |
Source: Public Records
Map
Nearby Homes
- 758 Briarwood Ln
- 741 Ponderosa Dr
- 756 Briarwood Ln
- 744 Briarwood Ln
- 425 Ridgecrest Dr
- 408 Simmons Dr
- 425 Moore Creek Rd
- 628 Elm St
- 612 Elm St
- 520 W Redbud Dr
- 708 Hurstview Dr
- 808 Betty Ct
- 637 Post Oak Dr
- 516 Hurstview Dr
- 616 Timberline Dr
- 405 Billy Creek Cir
- 649 Timberline Dr
- 829 Joanna Dr
- 632 Forest Ln
- 833 W Cheryl Ave
- 752 Oakwood Ave
- 760 Oakwood Ave
- 748 Oakwood Ave
- 764 Oakwood Ave
- 773 Briarwood Ln
- 771 Briarwood Ln
- 775 Briarwood Ln
- 757 Oakwood Ave
- 769 Briarwood Ln
- 753 Oakwood Ave
- 777 Briarwood Ln
- 761 Oakwood Ave
- 744 Oakwood Ave
- 768 Oakwood Ave
- 765 Oakwood Ave
- 779 Briarwood Ln
- 767 Briarwood Ln
- 740 Oakwood Ave
- 769 Oakwood Ave
- 745 Oakwood Ave