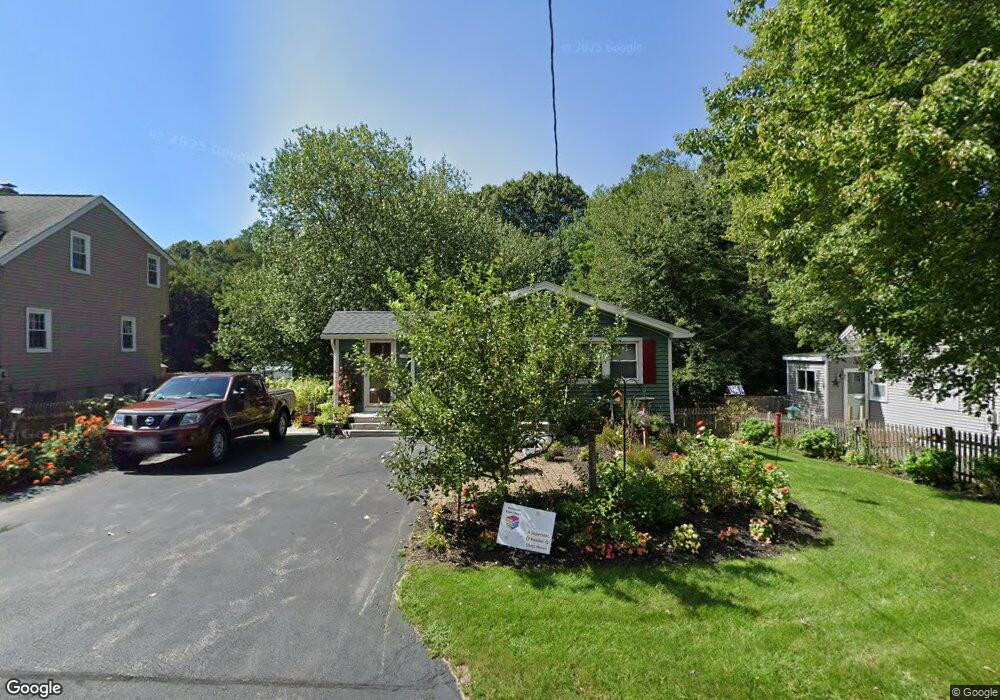
756 Rathbun St Blackstone, MA 01504
Estimated Value: $412,545 - $462,000
3
Beds
2
Baths
1,024
Sq Ft
$420/Sq Ft
Est. Value
About This Home
This home is located at 756 Rathbun St, Blackstone, MA 01504 and is currently estimated at $429,886, approximately $419 per square foot. 756 Rathbun St is a home located in Worcester County with nearby schools including Blackstone-Millville Regional High School, Rise Prep Mayoral Academy Middle School, and Rise Prep Mayoral Academy.
Ownership History
Date
Name
Owned For
Owner Type
Purchase Details
Closed on
Sep 18, 2009
Sold by
Mcguire Kevin W
Bought by
Collette Jeffrey E
Current Estimated Value
Home Financials for this Owner
Home Financials are based on the most recent Mortgage that was taken out on this home.
Original Mortgage
$228,928
Outstanding Balance
$150,401
Interest Rate
5.28%
Mortgage Type
Purchase Money Mortgage
Estimated Equity
$279,485
Purchase Details
Closed on
Jun 27, 2003
Sold by
Buel Patricia
Bought by
Mcguire Kevin W
Home Financials for this Owner
Home Financials are based on the most recent Mortgage that was taken out on this home.
Original Mortgage
$183,200
Interest Rate
5.53%
Mortgage Type
Purchase Money Mortgage
Purchase Details
Closed on
Jul 13, 1990
Sold by
Ofiara Edward J
Bought by
Buel David B
Create a Home Valuation Report for This Property
The Home Valuation Report is an in-depth analysis detailing your home's value as well as a comparison with similar homes in the area
Home Values in the Area
Average Home Value in this Area
Purchase History
| Date | Buyer | Sale Price | Title Company |
|---|---|---|---|
| Collette Jeffrey E | $224,500 | -- | |
| Mcguire Kevin W | $229,000 | -- | |
| Buel David B | $115,900 | -- |
Source: Public Records
Mortgage History
| Date | Status | Borrower | Loan Amount |
|---|---|---|---|
| Open | Collette Jeffrey E | $228,928 | |
| Previous Owner | Buel David B | $183,200 | |
| Previous Owner | Buel David B | $110,000 | |
| Previous Owner | Buel David B | $101,916 | |
| Previous Owner | Buel David B | $103,050 |
Source: Public Records
Tax History Compared to Growth
Tax History
| Year | Tax Paid | Tax Assessment Tax Assessment Total Assessment is a certain percentage of the fair market value that is determined by local assessors to be the total taxable value of land and additions on the property. | Land | Improvement |
|---|---|---|---|---|
| 2025 | $4,607 | $305,100 | $132,500 | $172,600 |
| 2024 | $5,226 | $320,000 | $139,100 | $180,900 |
| 2023 | $4,739 | $292,900 | $139,100 | $153,800 |
| 2022 | $4,767 | $266,300 | $126,600 | $139,700 |
| 2021 | $4,360 | $232,900 | $115,100 | $117,800 |
| 2020 | $4,611 | $244,500 | $115,000 | $129,500 |
| 2019 | $4,415 | $233,500 | $105,900 | $127,600 |
| 2018 | $5,298 | $209,200 | $100,800 | $108,400 |
| 2017 | $449 | $209,700 | $100,800 | $108,900 |
| 2016 | $3,994 | $206,500 | $91,900 | $114,600 |
| 2015 | $3,744 | $192,200 | $91,900 | $100,300 |
Source: Public Records
Map
Nearby Homes