Estimated Value: $221,000 - $249,000
3
Beds
2
Baths
1,232
Sq Ft
$194/Sq Ft
Est. Value
About This Home
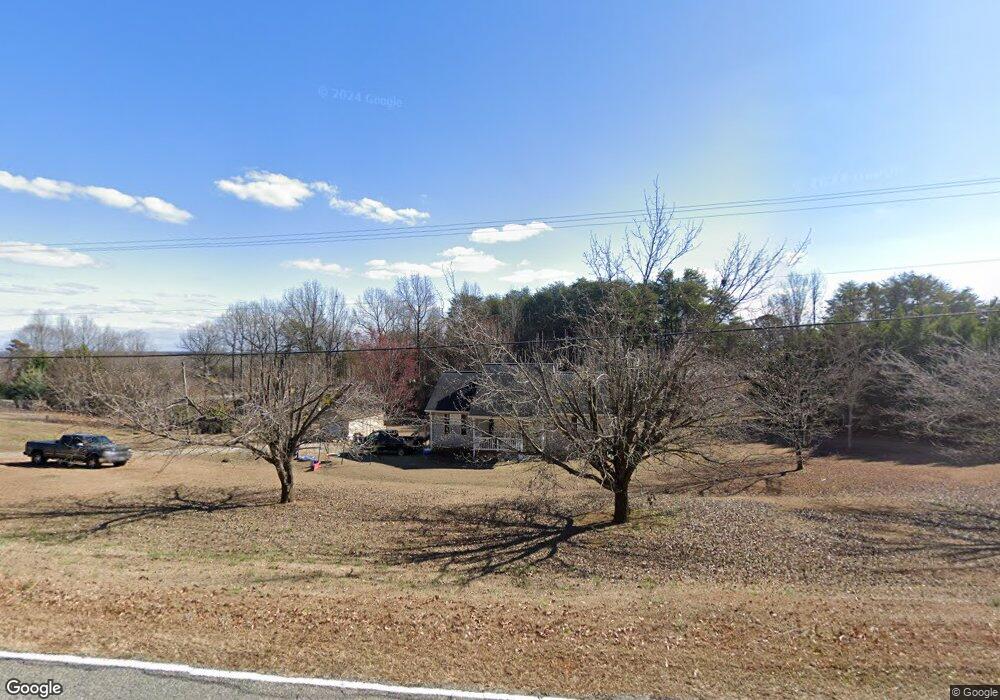
This home is located at 756 Windmill Hill Rd, Inman, SC 29349 and is currently estimated at $239,525, approximately $194 per square foot. 756 Windmill Hill Rd is a home located in Spartanburg County with nearby schools including Inman Elementary School, T.E. Mabry Middle School, and Chapman High School.
Ownership History
Date
Name
Owned For
Owner Type
Purchase Details
Closed on
Jun 7, 2019
Sold by
Martindale Kane J and Martindale Whitney M
Bought by
Terrell Nicholas Alexander and Wilson Morganne Lane
Current Estimated Value
Home Financials for this Owner
Home Financials are based on the most recent Mortgage that was taken out on this home.
Original Mortgage
$153,174
Outstanding Balance
$134,677
Interest Rate
4.1%
Mortgage Type
FHA
Estimated Equity
$104,848
Purchase Details
Closed on
Jul 23, 2009
Sold by
Huffman Edward T
Bought by
Martindale Kane J and Martindale Whitney M
Home Financials for this Owner
Home Financials are based on the most recent Mortgage that was taken out on this home.
Original Mortgage
$115,204
Interest Rate
5.36%
Mortgage Type
New Conventional
Purchase Details
Closed on
Sep 19, 2002
Sold by
Huffman Tina C
Bought by
Huffman Edward T
Purchase Details
Closed on
Jul 14, 1999
Sold by
Bud Campbell Jr Builder Inc
Bought by
Huffman Edward T and Huffman Tina C
Create a Home Valuation Report for This Property
The Home Valuation Report is an in-depth analysis detailing your home's value as well as a comparison with similar homes in the area
Home Values in the Area
Average Home Value in this Area
Purchase History
| Date | Buyer | Sale Price | Title Company |
|---|---|---|---|
| Terrell Nicholas Alexander | $156,000 | None Available | |
| Martindale Kane J | $112,900 | -- | |
| Huffman Edward T | -- | -- | |
| Huffman Edward T | $92,700 | -- |
Source: Public Records
Mortgage History
| Date | Status | Borrower | Loan Amount |
|---|---|---|---|
| Open | Terrell Nicholas Alexander | $153,174 | |
| Previous Owner | Martindale Kane J | $115,204 |
Source: Public Records
Tax History Compared to Growth
Tax History
| Year | Tax Paid | Tax Assessment Tax Assessment Total Assessment is a certain percentage of the fair market value that is determined by local assessors to be the total taxable value of land and additions on the property. | Land | Improvement |
|---|---|---|---|---|
| 2025 | $1,008 | $5,424 | $1,005 | $4,419 |
| 2024 | $1,008 | $5,424 | $1,005 | $4,419 |
| 2023 | $1,008 | $5,424 | $1,005 | $4,419 |
| 2022 | $911 | $4,716 | $800 | $3,916 |
| 2021 | $911 | $4,716 | $800 | $3,916 |
| 2020 | $895 | $4,716 | $800 | $3,916 |
| 2019 | $895 | $4,540 | $770 | $3,770 |
| 2018 | $863 | $4,540 | $770 | $3,770 |
| 2017 | $768 | $3,948 | $800 | $3,148 |
| 2016 | $768 | $3,948 | $800 | $3,148 |
| 2015 | $749 | $3,952 | $800 | $3,152 |
| 2014 | $744 | $3,952 | $800 | $3,152 |
Source: Public Records
Map
Nearby Homes
- 128 Cothran Rd
- 155 Cothran Rd
- 00 State Road S-42-371
- 0 Johnson Ave
- 415 Grady Dr
- 135 Glendarosa Dr
- 140 Golightly St
- 119 Beechwood Dr
- 255 Arena Park Dr
- 103 Guy Cothran Rd
- 111 Guy Cothran Rd
- 123 Guy Cothran Rd
- 107 Denali St
- 345 Bishop Hicks Ct
- 704 Adaline Dr
- 2160 Compton Bridge Rd
- 473 Meadow Rd
- 9041 Asheville Hwy
- 42 Bishop St
- 2340 Redwood Manor Ln
- 746 Windmill Hill Rd
- 778 Windmill Hill Rd
- 1565 Compton Bridge Rd
- 761 Windmill Hill Rd
- 767 Windmill Hill Rd
- 757 Windmill Hill Rd
- 1559 Compton Bridge Rd
- 121 Wildflower Ln
- 736 Windmill Hill Rd
- 796 Windmill Hill Rd
- 1553 Compton Bridge Rd
- 781 Windmill Hill Rd
- 730 Windmill Hill Rd
- 1543 Compton Bridge Rd
- 127 Wildflower Ln
- 115 Wildflower Ln
- 720 Windmill Hill Rd
- 109 Wildflower Ln
- 133 Wildflower Ln
- 1590 Compton Bridge Rd