
Seller's Agent in 2025
Damien Baden
EXP Realty, LLC.
(440) 628-1321
3 in this area
96 Total Sales

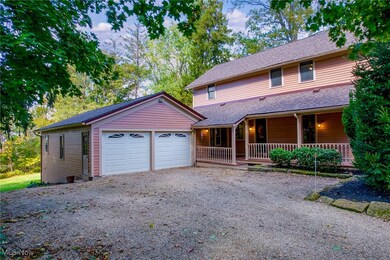
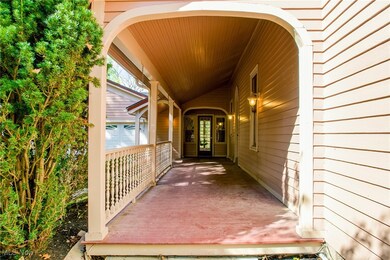

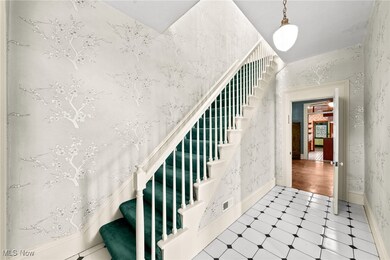
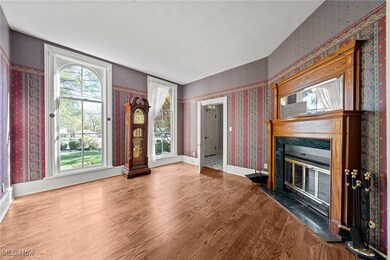
Rare opportunity to own a piece of Olmsted Falls architectural heritage. Listed on the National Register of Historic Places, this historical treasure was built in 1860 by Edward Wade Kidney, a Civil War veteran and one of the town's most prominent entrepreneurs, industrialists and inventors. Nestled among mature trees and extensive garden beds, this proud Italianate exudes timeless European elegance and stands as a testament to craftsmanship, character, and legacy. While the interior awaits thoughtful restoration, its bones are strong and its spirit enduring. Homes like this are more than historic; they’re a symbol of community pride. Preserving this piece of living history is a love letter to a bygone era, honoring the town's identity and the generations who’ve called this place home. For preservationists, visionaries, and historical enthusiasts—this is your canvas... There are several versatile living areas to customize to your lifestyle. The massive family room behind the garage is ideal for a game/rec room. Grand formal dining room easily accommodates an extra-large table for all your guests during holidays and celebrations. Convenient first-floor laundry room with abundant storage and a mudroom with space for bench and cubbies. Your oversized owner’s suite boasts a walk-in closet, cedar closet, dressing area with a vanity and sink, and large bathroom. Enjoy three alfresco living areas: a flagstone patio, covered porch, or sprawling 3-season porch overlooking the treed backyard! Front yard irrigation. Attached 2-car garage. RECENT UPDATES: NEW ROOF & main floor HVAC 2025, mini split and 2nd floor HVAC serviced 2025, exterior painted 2024. Walk to three parks and the Grand Pacific Junction Historic Shopping District within 10 min! Metroparks and All-Purpose Trail is a 6-min drive. Great Northern Mall is just 9 min. Great for commuting: 7 min to I-480, 11 min to I-71, 12 min to I-80/Turnpike.
Last Agent to Sell the Property
EXP Realty, LLC. Brokerage Email: damien@realtydone.com, 440-670-0344 License #2007004205 Listed on: 10/17/2025
| Date | Type | Sale Price | Title Company |
|---|---|---|---|
| Interfamily Deed Transfer | -- | Ohio Real Title | |
| Deed | $237,500 | -- | |
| Deed | $63,000 | -- | |
| Deed | $57,000 | -- | |
| Deed | -- | -- |
| Date | Status | Loan Amount | Loan Type |
|---|---|---|---|
| Open | $170,000 | New Conventional | |
| Closed | $190,000 | New Conventional |
| Date | Event | Price | List to Sale | Price per Sq Ft |
|---|---|---|---|---|
| 12/03/2025 12/03/25 | Sold | $350,000 | -6.7% | $112 / Sq Ft |
| 10/31/2025 10/31/25 | Pending | -- | -- | -- |
| 10/25/2025 10/25/25 | Price Changed | $375,000 | -6.3% | $120 / Sq Ft |
| 10/17/2025 10/17/25 | For Sale | $400,000 | -- | $128 / Sq Ft |
| Year | Tax Paid | Tax Assessment Tax Assessment Total Assessment is a certain percentage of the fair market value that is determined by local assessors to be the total taxable value of land and additions on the property. | Land | Improvement |
|---|---|---|---|---|
| 2024 | $9,282 | $135,695 | $19,565 | $116,130 |
| 2023 | $8,501 | $101,120 | $18,830 | $82,290 |
| 2022 | $8,437 | $101,115 | $18,830 | $82,285 |
| 2021 | $7,794 | $101,120 | $18,830 | $82,290 |
| 2020 | $7,041 | $80,890 | $15,050 | $65,840 |
| 2019 | $6,250 | $231,100 | $43,000 | $188,100 |
| 2018 | $6,884 | $80,890 | $15,050 | $65,840 |
| 2017 | $7,372 | $88,730 | $14,630 | $74,100 |
| 2016 | $7,337 | $88,730 | $14,630 | $74,100 |
| 2015 | $10,842 | $88,730 | $14,630 | $74,100 |
| 2014 | $10,842 | $82,150 | $13,550 | $68,600 |
Seller's Agent in 2025
Damien Baden
EXP Realty, LLC.
(440) 628-1321
3 in this area
96 Total Sales
Buyer's Agent in 2025
James Fowler
Century 21 DeAnna Realty
(330) 323-3356
11 in this area
155 Total Sales
Source: MLS Now
MLS Number: 5165263
APN: 281-12-006
Disclaimer: Certain information contained herein is derived from information provided by parties other than Homes.com. All information provided is deemed reliable, but is not guaranteed to be accurate and should be independently verified.
![]() IDX information is provided exclusively for personal, non-commercial use, and may not be used for any purpose other than to identify prospective properties consumers may be interested in purchasing. Information is deemed reliable but not guaranteed.
IDX information is provided exclusively for personal, non-commercial use, and may not be used for any purpose other than to identify prospective properties consumers may be interested in purchasing. Information is deemed reliable but not guaranteed.