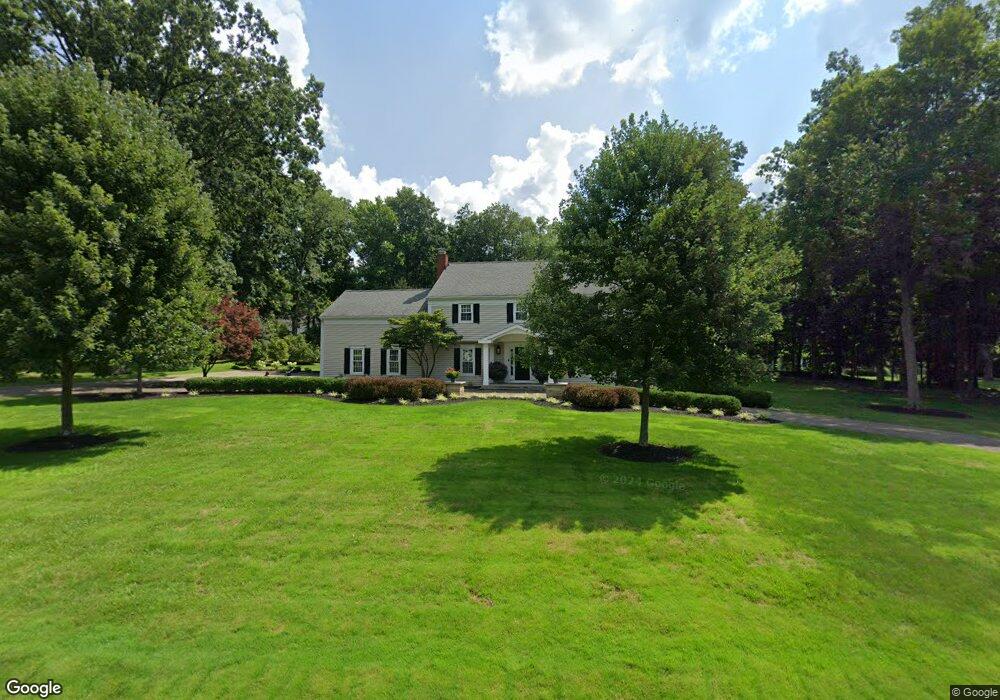
7565 Deerpath Trail Hudson, OH 44236
Estimated Value: $466,000 - $635,000
4
Beds
4
Baths
3,371
Sq Ft
$165/Sq Ft
Est. Value
About This Home
This home is located at 7565 Deerpath Trail, Hudson, OH 44236 and is currently estimated at $555,684, approximately $164 per square foot. 7565 Deerpath Trail is a home located in Summit County with nearby schools including Ellsworth Hill Elementary School, East Woods Intermediate School, and Hudson Middle School.
Ownership History
Date
Name
Owned For
Owner Type
Purchase Details
Closed on
Jun 24, 2002
Sold by
Trustees Haynes Maracus Andrew & Lori Dawn C
Bought by
Wright Scott R and Wright Linda S
Current Estimated Value
Home Financials for this Owner
Home Financials are based on the most recent Mortgage that was taken out on this home.
Original Mortgage
$45,000
Outstanding Balance
$19,108
Interest Rate
6.87%
Mortgage Type
Purchase Money Mortgage
Estimated Equity
$536,576
Purchase Details
Closed on
Dec 21, 1999
Sold by
Haynes Marcus A and Haynes Lori D
Bought by
Haynes Marcus Andrew and Haynes Lori Dawn
Purchase Details
Closed on
May 10, 1996
Sold by
Gabal James M
Bought by
Haynes Marcus A and Haynes Lori
Home Financials for this Owner
Home Financials are based on the most recent Mortgage that was taken out on this home.
Original Mortgage
$179,775
Interest Rate
7.78%
Mortgage Type
New Conventional
Create a Home Valuation Report for This Property
The Home Valuation Report is an in-depth analysis detailing your home's value as well as a comparison with similar homes in the area
Home Values in the Area
Average Home Value in this Area
Purchase History
| Date | Buyer | Sale Price | Title Company |
|---|---|---|---|
| Wright Scott R | $30,200 | Midland Commerce Group | |
| Haynes Marcus Andrew | -- | -- | |
| Haynes Marcus A | $211,500 | -- |
Source: Public Records
Mortgage History
| Date | Status | Borrower | Loan Amount |
|---|---|---|---|
| Open | Wright Scott R | $45,000 | |
| Previous Owner | Haynes Marcus A | $179,775 |
Source: Public Records
Tax History Compared to Growth
Tax History
| Year | Tax Paid | Tax Assessment Tax Assessment Total Assessment is a certain percentage of the fair market value that is determined by local assessors to be the total taxable value of land and additions on the property. | Land | Improvement |
|---|---|---|---|---|
| 2025 | $6,849 | $134,512 | $26,558 | $107,954 |
| 2024 | $6,849 | $134,512 | $26,558 | $107,954 |
| 2023 | $6,849 | $134,512 | $26,558 | $107,954 |
| 2022 | $6,344 | $111,168 | $21,949 | $89,219 |
| 2021 | $6,354 | $111,168 | $21,949 | $89,219 |
| 2020 | $6,242 | $111,170 | $21,950 | $89,220 |
| 2019 | $6,236 | $102,820 | $19,160 | $83,660 |
| 2018 | $6,213 | $102,820 | $19,160 | $83,660 |
| 2017 | $5,042 | $102,820 | $19,160 | $83,660 |
| 2016 | $5,079 | $80,940 | $19,160 | $61,780 |
| 2015 | $5,042 | $80,940 | $19,160 | $61,780 |
| 2014 | $5,057 | $80,940 | $19,160 | $61,780 |
| 2013 | $4,919 | $76,870 | $19,160 | $57,710 |
Source: Public Records
Map
Nearby Homes
- 7603 Red Fox Trail
- 7753 Red Fox Trail
- 2664 Easthaven Dr
- 7205 Dillman Dr
- 7687 Ravenna Rd
- 2221 Kate Ct
- 2346 Danbury Ln
- 2380 Victoria Pkwy
- 7511 Herrick Park Dr
- 8028 Megan Meadow Dr
- 3425 Eryn Place
- 6751 Pheasants Ridge
- 2061 Garden Ln
- 6869 Saint Regis Blvd
- 2219 Fairway Blvd Unit 4E
- 2142 Kirtland Place
- 157 Hudson St
- 558 Frost Rd
- 6607 Dunbarton Dr
- 35 S Hayden Pkwy
- 2821 Woodbridge Rd
- 7585 Deerpath Trail
- 7568 Deerpath Trail
- 7562 Sugarbush Trail
- 7582 Sugarbush Trail
- 7586 Deerpath Trail
- 2816 Woodbridge Rd
- 7605 Deerpath Trail
- 2796 Woodbridge Rd
- 2841 Woodbridge Rd
- 7602 Sugarbush Trail
- 7606 Deerpath Trail
- 2753 Woodbridge Rd
- 2838 Woodbridge Rd
- 7605 Stow Rd
- 7563 Sugarbush Trail
- 7583 Sugarbush Trail
- 7625 Deerpath Trail
- 7543 Sugarbush Trail
- 7543 Stow Rd