757 Draper Heights Way Unit 107 Draper, UT 84020
Estimated Value: $1,657,000 - $1,708,577
7
Beds
4
Baths
3,803
Sq Ft
$441/Sq Ft
Est. Value
About This Home
This home is located at 757 Draper Heights Way Unit 107, Draper, UT 84020 and is currently estimated at $1,678,192, approximately $441 per square foot. 757 Draper Heights Way Unit 107 is a home located in Salt Lake County with nearby schools including Oak Hollow School, Draper Park Middle School, and Corner Canyon High School.
Ownership History
Date
Name
Owned For
Owner Type
Purchase Details
Closed on
Sep 2, 2025
Sold by
Rowe Earl L and Rowe Jill A
Bought by
Earl And Jill Rowe Living Trust and Rowe
Current Estimated Value
Purchase Details
Closed on
Dec 17, 2010
Sold by
Rowe Earl L and Rowe Jill Anne
Bought by
Rowe Earl L and Rowe Jill A
Home Financials for this Owner
Home Financials are based on the most recent Mortgage that was taken out on this home.
Original Mortgage
$396,800
Interest Rate
4.17%
Mortgage Type
New Conventional
Purchase Details
Closed on
Oct 30, 2002
Sold by
Foster Jay
Bought by
Rowe Earl L and Rowe Jill Anne
Home Financials for this Owner
Home Financials are based on the most recent Mortgage that was taken out on this home.
Original Mortgage
$370,000
Interest Rate
3.62%
Purchase Details
Closed on
Feb 5, 2002
Sold by
Lither Gabriel D and Lither Rebecca W
Bought by
Foster Jay
Purchase Details
Closed on
Dec 21, 1999
Sold by
U S General Inc
Bought by
Lither Gabriel D and Lither Rebecca W
Create a Home Valuation Report for This Property
The Home Valuation Report is an in-depth analysis detailing your home's value as well as a comparison with similar homes in the area
Home Values in the Area
Average Home Value in this Area
Purchase History
| Date | Buyer | Sale Price | Title Company |
|---|---|---|---|
| Earl And Jill Rowe Living Trust | -- | None Listed On Document | |
| Rowe Earl L | -- | First American Title Ut Co | |
| Rowe Earl L | -- | Superior Title | |
| Foster Jay | -- | Bonneville Title Co | |
| Lither Gabriel D | -- | First American Title Ins Co |
Source: Public Records
Mortgage History
| Date | Status | Borrower | Loan Amount |
|---|---|---|---|
| Previous Owner | Rowe Earl L | $396,800 | |
| Previous Owner | Rowe Earl L | $370,000 |
Source: Public Records
Tax History Compared to Growth
Tax History
| Year | Tax Paid | Tax Assessment Tax Assessment Total Assessment is a certain percentage of the fair market value that is determined by local assessors to be the total taxable value of land and additions on the property. | Land | Improvement |
|---|---|---|---|---|
| 2025 | $299 | $1,509,300 | $410,600 | $1,098,700 |
| 2024 | $299 | $1,348,700 | $398,900 | $949,800 |
| 2023 | $162 | $1,283,000 | $392,500 | $890,500 |
| 2022 | $162 | $1,285,700 | $384,800 | $900,900 |
| 2021 | $358 | $1,073,200 | $308,100 | $765,100 |
| 2020 | $6,503 | $964,500 | $286,500 | $678,000 |
| 2019 | $2,108 | $957,600 | $281,100 | $676,500 |
| 2018 | $6,353 | $941,000 | $281,100 | $659,900 |
| 2017 | $6,473 | $918,500 | $268,100 | $650,400 |
| 2016 | $6,390 | $881,100 | $268,100 | $613,000 |
| 2015 | $6,266 | $800,100 | $238,300 | $561,800 |
| 2014 | $5,830 | $727,200 | $251,500 | $475,700 |
Source: Public Records
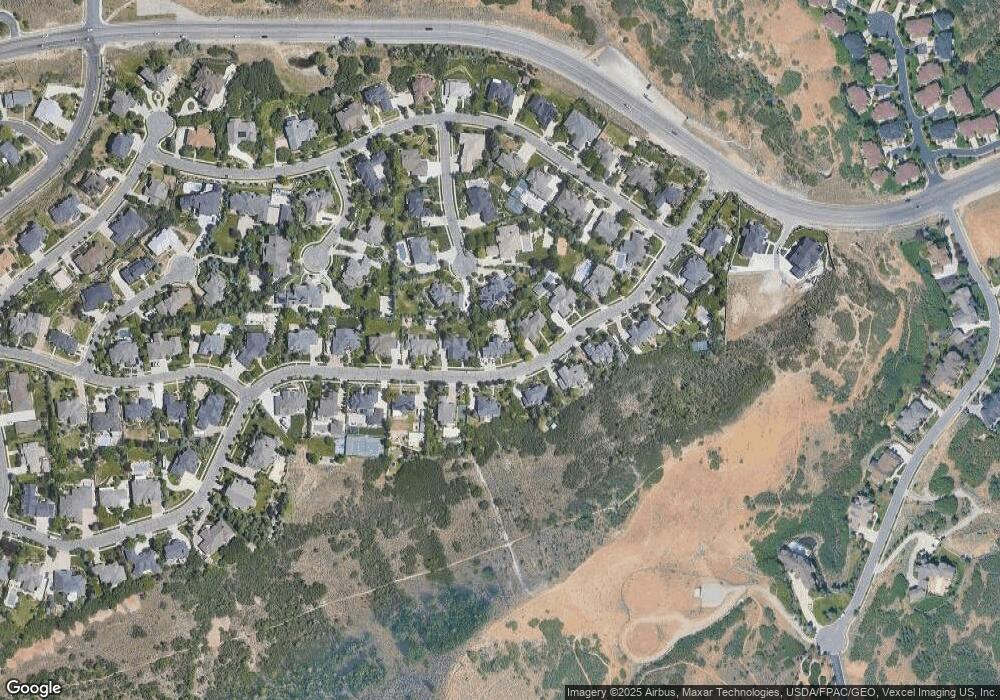
Map
Nearby Homes
- 14687 S Nestled Cove
- 581 E Draper Woods Way
- 909 E Rosebud Ct
- 898 E Tendoy Ct
- 492 W Maidengrass Way
- 14669 S Faulkridge Ct Unit 106
- 14793 S Vintage View Ln Unit 14
- 13164 S City Point Cove Unit 1
- 1314 E Victor Ln
- 13189 S City Point Cove E Unit 4
- 1349 E Elk Unit 33
- 427 E Parowan Way
- 14659 S Culross Ln
- 413 Steep Mountain Dr
- 455 E Rocky Mouth Ln
- 308 E Brayden Way
- 928 E Rocky Mouth Ln
- 919 E Rocky Mouth Ln
- 14345 Lapis Dr
- 328 E Tri Ln
- 757 Draper Heights Way
- 743 Draper Heights Way
- 743 E Draper Heights Way Unit 108
- 743 E Draper Heights Way
- 769 Draper Heights Way
- 769 Draper Heights Way Unit 106
- 14723 Draper View Cove
- 14723 S Draper View Cove Unit 95
- 14723 S Draper View Cove
- 758 Draper Heights Way
- 758 E Draper Heights Way
- 733 Draper Heights Way
- 733 Draper Heights Way Unit 109
- 744 Draper Heights Way
- 744 Draper Heights Way Unit 48
- 779 E Draper Heights Way Unit 105
- 779 E Draper Heights Way
- 779 Draper Heights Way
- 14724 Draper View Cove
- 14724 S Draper View Cove