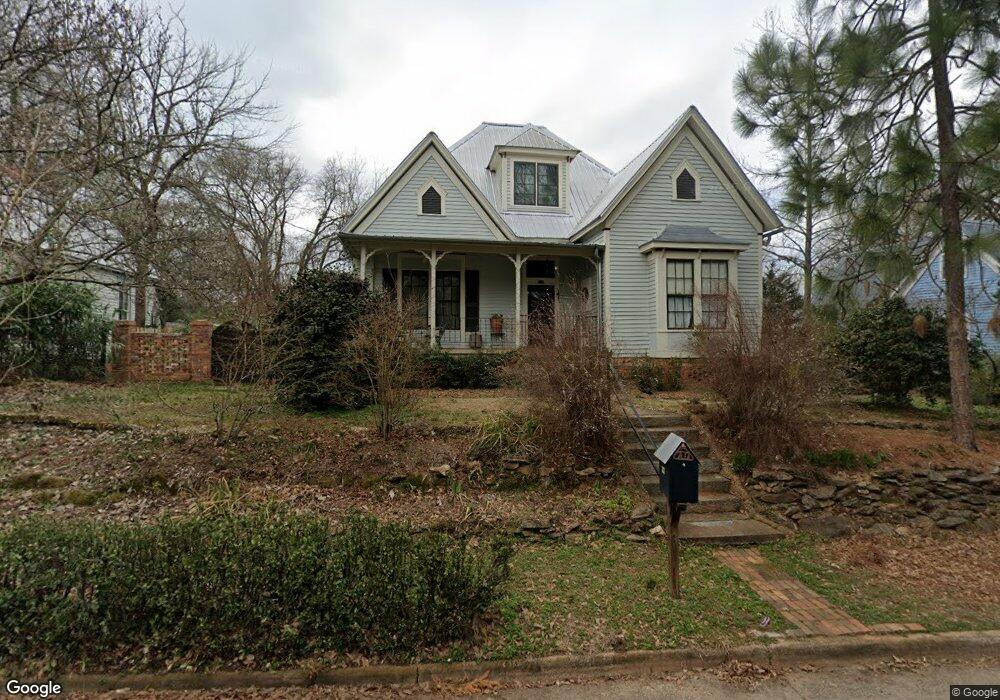
757 Pulaski St Athens, GA 30601
Newtown NeighborhoodEstimated Value: $561,000 - $773,511
Studio
--
Bath
2,714
Sq Ft
$248/Sq Ft
Est. Value
About This Home
This home is located at 757 Pulaski St, Athens, GA 30601 and is currently estimated at $673,628, approximately $248 per square foot. 757 Pulaski St is a home located in Clarke County with nearby schools including Barrow Elementary School, Clarke Middle School, and Clarke Central High School.
Ownership History
Date
Name
Owned For
Owner Type
Purchase Details
Closed on
Dec 21, 2007
Sold by
Not Provided
Bought by
Johnston Cameron C and Garrard Patrick H
Current Estimated Value
Home Financials for this Owner
Home Financials are based on the most recent Mortgage that was taken out on this home.
Original Mortgage
$188,000
Outstanding Balance
$117,530
Interest Rate
6.15%
Mortgage Type
New Conventional
Estimated Equity
$556,098
Purchase Details
Closed on
Dec 20, 2007
Sold by
Not Provided
Bought by
Johnston Cameron C and Garrard Patrick H
Home Financials for this Owner
Home Financials are based on the most recent Mortgage that was taken out on this home.
Original Mortgage
$188,000
Outstanding Balance
$117,530
Interest Rate
6.15%
Mortgage Type
New Conventional
Estimated Equity
$556,098
Purchase Details
Closed on
Oct 30, 1999
Sold by
Hinesley Rosena As Executrix
Bought by
Johnston Robert D V
Purchase Details
Closed on
Feb 1, 1999
Sold by
Zeberg Katie Louise Life Estate
Bought by
Hinesley Rosena As Executrix
Create a Home Valuation Report for This Property
The Home Valuation Report is an in-depth analysis detailing your home's value as well as a comparison with similar homes in the area
Home Values in the Area
Average Home Value in this Area
Purchase History
| Date | Buyer | Sale Price | Title Company |
|---|---|---|---|
| Johnston Cameron C | $235,000 | -- | |
| Johnston Cameron C | -- | -- | |
| Johnston Robert D V | $90,000 | -- | |
| Hinesley Rosena As Executrix | -- | -- |
Source: Public Records
Mortgage History
| Date | Status | Borrower | Loan Amount |
|---|---|---|---|
| Open | Johnston Cameron C | $188,000 | |
| Closed | Johnston Cameron C | $35,038 | |
| Closed | Johnston Cameron C | $188,000 |
Source: Public Records
Tax History
| Year | Tax Paid | Tax Assessment Tax Assessment Total Assessment is a certain percentage of the fair market value that is determined by local assessors to be the total taxable value of land and additions on the property. | Land | Improvement |
|---|---|---|---|---|
| 2025 | $8,002 | $283,272 | $28,000 | $255,272 |
| 2024 | $7,589 | $258,833 | $28,000 | $230,833 |
| 2023 | $7,589 | $247,224 | $28,000 | $219,224 |
| 2022 | $6,341 | $208,768 | $28,000 | $180,768 |
| 2021 | $5,553 | $174,775 | $28,000 | $146,775 |
| 2020 | $5,146 | $162,694 | $24,000 | $138,694 |
| 2019 | $4,058 | $129,523 | $20,000 | $109,523 |
| 2018 | $3,893 | $124,682 | $20,000 | $104,682 |
| 2017 | $3,345 | $108,516 | $20,000 | $88,516 |
| 2016 | $2,908 | $95,658 | $20,000 | $75,658 |
| 2015 | $2,869 | $94,372 | $20,000 | $74,372 |
| 2014 | $2,587 | $85,943 | $18,000 | $67,943 |
Source: Public Records
Map
Nearby Homes
- 145 Hendrix Ave
- 442 Cleveland Ave
- 600 Pulaski St
- 390 Athens Ave
- 330 Augusta Ave
- 940 College Ave
- 1030 Dr Martin Luther King Pkwy
- 800 College Ave
- 100 Prince Ave Unit A404
- 100 Prince Ave Unit A407
- 118 Ruth Dr Unit 130
- 118 Ruth Dr Unit 310
- 118 Ruth Dr Unit 140
- 118 Ruth Dr Unit 610
- 570 Prince Ave
- 190 Conrad Dr
- 947 N Chase St
- 247 E Washington St Unit 302
- 247 E Washington St Unit 308
- 247 E Washington St Unit 207
- 733 Pulaski St
- 767 Pulaski St
- 731 Pulaski St
- 121 Kendene St
- 775 Pulaski St
- 111 Kendene St
- 133 Kendene St
- 729 Pulaski St
- 141 Kendene St
- 762 Pulaski St
- 235 Cleveland Ave
- 227 Cleveland Ave
- 746 Pulaski St
- 725 Pulaski St
- 243 Cleveland Ave
- 782 Pulaski St
- 732 Pulaski St
- 730 Pulaski St
- 170 Tibbetts St
- 790 Pulaski St
Your Personal Tour Guide
Ask me questions while you tour the home.