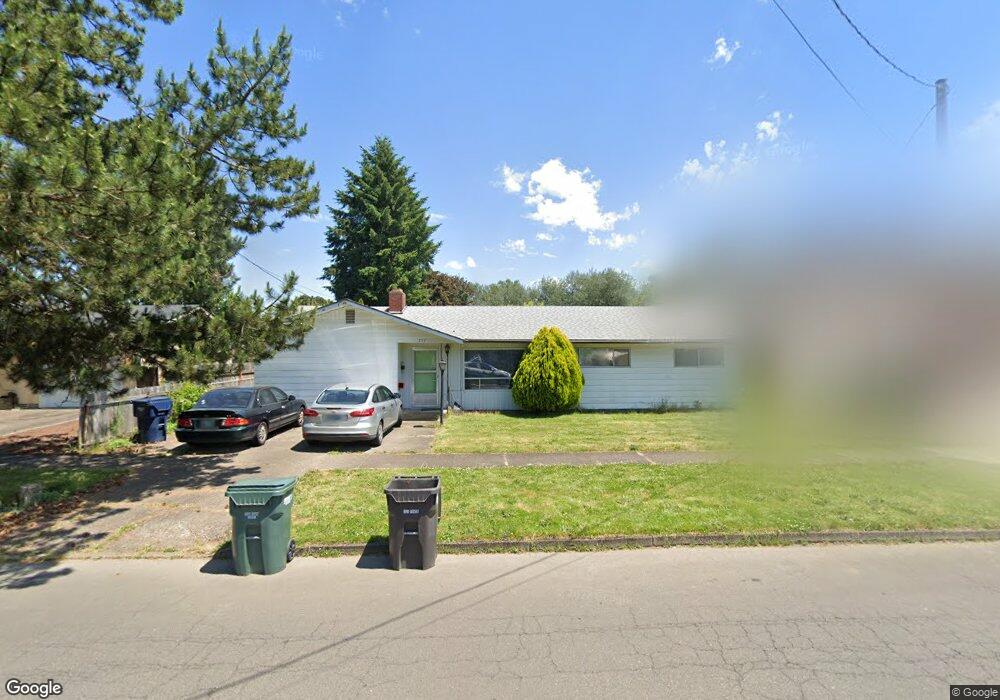
757 S 4th St Independence, OR 97351
Estimated Value: $349,000 - $406,000
3
Beds
2
Baths
1,380
Sq Ft
$274/Sq Ft
Est. Value
About This Home
This home is located at 757 S 4th St, Independence, OR 97351 and is currently estimated at $377,938, approximately $273 per square foot. 757 S 4th St is a home located in Polk County with nearby schools including Independence Elementary School, Talmadge Middle School, and Central High School.
Ownership History
Date
Name
Owned For
Owner Type
Purchase Details
Closed on
Jun 17, 2009
Sold by
Thom Bobby and Thom Esther Mae
Bought by
Chiarappa Veronica L and Kuhl Victoria L
Current Estimated Value
Home Financials for this Owner
Home Financials are based on the most recent Mortgage that was taken out on this home.
Original Mortgage
$142,800
Outstanding Balance
$90,466
Interest Rate
4.82%
Mortgage Type
Purchase Money Mortgage
Estimated Equity
$287,472
Create a Home Valuation Report for This Property
The Home Valuation Report is an in-depth analysis detailing your home's value as well as a comparison with similar homes in the area
Home Values in the Area
Average Home Value in this Area
Purchase History
| Date | Buyer | Sale Price | Title Company |
|---|---|---|---|
| Chiarappa Veronica L | $145,000 | Ticor Title |
Source: Public Records
Mortgage History
| Date | Status | Borrower | Loan Amount |
|---|---|---|---|
| Open | Chiarappa Veronica L | $142,800 |
Source: Public Records
Tax History
| Year | Tax Paid | Tax Assessment Tax Assessment Total Assessment is a certain percentage of the fair market value that is determined by local assessors to be the total taxable value of land and additions on the property. | Land | Improvement |
|---|---|---|---|---|
| 2025 | $2,687 | $152,770 | $39,470 | $113,300 |
| 2024 | $2,687 | $148,330 | $38,320 | $110,010 |
| 2023 | $2,755 | $144,010 | $37,210 | $106,800 |
| 2022 | $2,530 | $139,820 | $36,130 | $103,690 |
| 2021 | $2,502 | $135,750 | $35,070 | $100,680 |
| 2020 | $2,436 | $131,800 | $34,050 | $97,750 |
| 2019 | $2,373 | $127,970 | $33,060 | $94,910 |
| 2018 | $2,298 | $124,250 | $32,090 | $92,160 |
| 2017 | $2,285 | $120,640 | $31,160 | $89,480 |
| 2016 | $2,327 | $117,130 | $30,250 | $86,880 |
Source: Public Records
Map
Nearby Homes
Your Personal Tour Guide
Ask me questions while you tour the home.