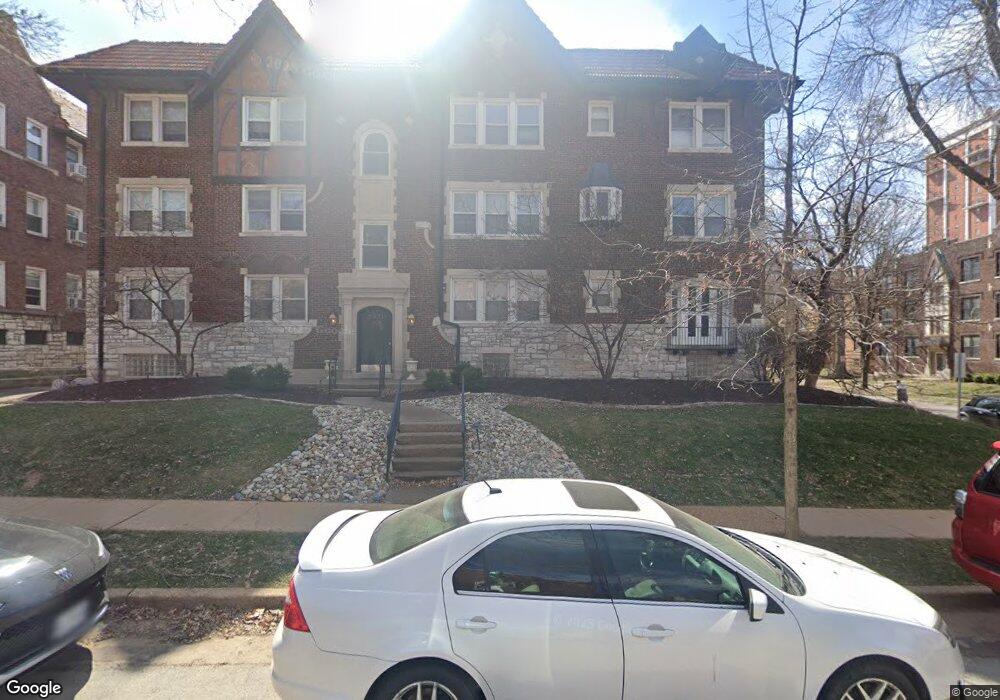
7570 Byron Place Unit 2N Saint Louis, MO 63105
Downtown Clayton NeighborhoodEstimated Value: $222,000 - $244,000
2
Beds
3
Baths
984
Sq Ft
$235/Sq Ft
Est. Value
About This Home
This home is located at 7570 Byron Place Unit 2N, Saint Louis, MO 63105 and is currently estimated at $231,206, approximately $234 per square foot. 7570 Byron Place Unit 2N is a home located in St. Louis County with nearby schools including Glenridge Elementary School, Wydown Middle School, and Clayton High School.
Ownership History
Date
Name
Owned For
Owner Type
Purchase Details
Closed on
Aug 3, 2023
Sold by
Berberian George and Berberian Soce
Bought by
Gibbons Nathan Alexander
Current Estimated Value
Home Financials for this Owner
Home Financials are based on the most recent Mortgage that was taken out on this home.
Original Mortgage
$157,000
Outstanding Balance
$153,171
Interest Rate
6.67%
Mortgage Type
New Conventional
Estimated Equity
$78,035
Purchase Details
Closed on
Feb 5, 2015
Sold by
Holton J Richard C J and Holton Kristen
Bought by
Hedeshian Soce and Hedeshian H
Home Financials for this Owner
Home Financials are based on the most recent Mortgage that was taken out on this home.
Original Mortgage
$80,000
Interest Rate
3.92%
Mortgage Type
New Conventional
Purchase Details
Closed on
Apr 27, 2011
Sold by
Gulley Kristen E and Holton Kristen G
Bought by
Holton Richard C
Purchase Details
Closed on
Mar 30, 2005
Sold by
Westwood Holdings Llc
Bought by
Gulley Kristen E
Home Financials for this Owner
Home Financials are based on the most recent Mortgage that was taken out on this home.
Original Mortgage
$123,062
Interest Rate
5.71%
Mortgage Type
Purchase Money Mortgage
Create a Home Valuation Report for This Property
The Home Valuation Report is an in-depth analysis detailing your home's value as well as a comparison with similar homes in the area
Home Values in the Area
Average Home Value in this Area
Purchase History
| Date | Buyer | Sale Price | Title Company |
|---|---|---|---|
| Gibbons Nathan Alexander | -- | None Listed On Document | |
| Hedeshian Soce | -- | -- | |
| Holton Richard C | -- | None Available | |
| Gulley Kristen E | $259,000 | -- |
Source: Public Records
Mortgage History
| Date | Status | Borrower | Loan Amount |
|---|---|---|---|
| Open | Gibbons Nathan Alexander | $157,000 | |
| Previous Owner | Hedeshian Soce | $80,000 | |
| Previous Owner | Gulley Kristen E | $123,062 |
Source: Public Records
Tax History Compared to Growth
Tax History
| Year | Tax Paid | Tax Assessment Tax Assessment Total Assessment is a certain percentage of the fair market value that is determined by local assessors to be the total taxable value of land and additions on the property. | Land | Improvement |
|---|---|---|---|---|
| 2025 | $2,355 | $38,230 | $11,970 | $26,260 |
| 2024 | $2,355 | $34,290 | $14,400 | $19,890 |
| 2023 | $2,355 | $34,290 | $14,400 | $19,890 |
| 2022 | $2,512 | $34,670 | $15,880 | $18,790 |
| 2021 | $2,504 | $34,670 | $15,880 | $18,790 |
| 2020 | $2,438 | $32,700 | $15,880 | $16,820 |
| 2019 | $2,406 | $32,700 | $15,880 | $16,820 |
| 2018 | $2,047 | $28,250 | $14,400 | $13,850 |
| 2017 | $2,034 | $28,250 | $14,400 | $13,850 |
| 2016 | $2,383 | $31,600 | $10,850 | $20,750 |
| 2015 | $2,404 | $31,600 | $10,850 | $20,750 |
| 2014 | $2,735 | $34,580 | $17,350 | $17,230 |
Source: Public Records
Map
Nearby Homes
- 7570 Byron Place Unit 1E
- 7538 Wydown Blvd Unit 1A
- 710 S Hanley Rd Unit 17C
- 710 S Hanley Rd Unit 18B
- 7521 Byron Place Unit 3E
- 750 S Hanley Rd Unit 180
- 750 S Hanley Rd Unit 68
- 750 S Hanley Rd Unit 120
- 7520 Buckingham Dr Unit 1W
- 7545 Wellington Way Unit 2B
- 7547 Wellington Way Unit 2C
- 816 S Hanley Rd Unit 8C
- 900 S Hanley Rd Unit 15B
- 900 S Hanley Rd Unit 7E
- 900 S Hanley Rd Unit 12A
- 900 S Hanley Rd Unit 6E
- 7544 York Dr Unit 3W
- 7544 York Dr Unit 3E
- 907 S Hanley Rd Unit 5
- 923 S Hanley Rd Unit A
- 7570 Byron Place Unit 2W
- 7570 Byron Place Unit 3W
- 7570 Byron Place Unit 2E
- 7570 Byron Place Unit 2S
- 7570 Byron Place Unit 3S
- 7570 Byron Place Unit 3N
- 7570 Byron Place Unit 1W
- 7570 Byron Place Unit 1S
- 7570 Byron Place Unit 1N
- 630 Westwood Dr Unit 1S
- 630 Westwood Dr Unit 3-S
- 630 Westwood Dr Unit 2S
- 630 Westwood Dr Unit 2N
- 630 Westwood Dr Unit 1N
- 619 Westwood Dr
- 621 Westwood Dr
- 621 Westwood Dr Unit 2N
- 621 Westwood Dr Unit 2S
- 621 Westwood Dr Unit 1N
- 621 Westwood Dr Unit 3N