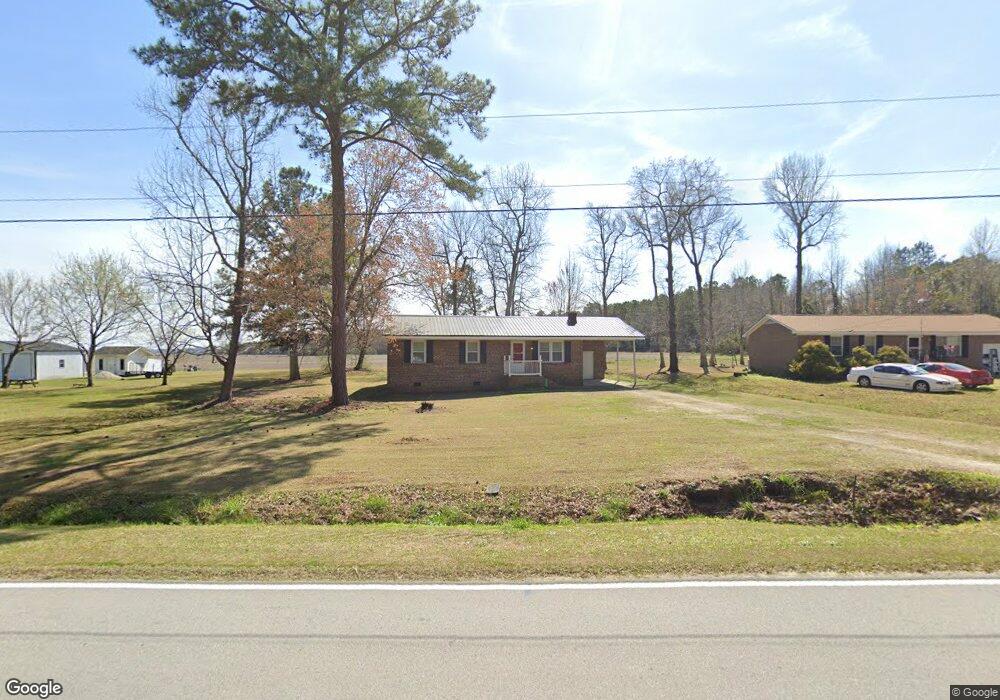
7571 Kershaw Rd Arapahoe, NC 28510
Estimated Value: $118,000 - $273,000
3
Beds
1
Bath
1,025
Sq Ft
$158/Sq Ft
Est. Value
About This Home
This home is located at 7571 Kershaw Rd, Arapahoe, NC 28510 and is currently estimated at $162,269, approximately $158 per square foot. 7571 Kershaw Rd is a home located in Pamlico County with nearby schools including Pamlico County Primary School, Fred A. Anderson Elementary School, and Pamlico County Middle School.
Ownership History
Date
Name
Owned For
Owner Type
Purchase Details
Closed on
Jan 18, 2024
Sold by
Broughton Michael E and Broughton Linda D
Bought by
Collins Jaron and Collins Jerlvine
Current Estimated Value
Purchase Details
Closed on
Jun 3, 2008
Sold by
Marshland Co Llc
Bought by
Broughton Michael E and Broughton Linda D
Home Financials for this Owner
Home Financials are based on the most recent Mortgage that was taken out on this home.
Original Mortgage
$77,137
Interest Rate
6.04%
Mortgage Type
New Conventional
Purchase Details
Closed on
Jan 23, 2008
Sold by
Bank Of New York
Bought by
Marshalnd Co Llc
Purchase Details
Closed on
Aug 10, 2007
Sold by
Hackney Frederick L and Hackney Valerie B
Bought by
Bank Of New York
Purchase Details
Closed on
Nov 1, 1983
Bought by
Hackney Frederick Lee
Create a Home Valuation Report for This Property
The Home Valuation Report is an in-depth analysis detailing your home's value as well as a comparison with similar homes in the area
Home Values in the Area
Average Home Value in this Area
Purchase History
| Date | Buyer | Sale Price | Title Company |
|---|---|---|---|
| Collins Jaron | $100,000 | None Listed On Document | |
| Broughton Michael E | $82,000 | None Available | |
| Marshalnd Co Llc | $31,000 | None Available | |
| Bank Of New York | $40,768 | None Available | |
| Hackney Frederick Lee | $82,000 | -- |
Source: Public Records
Mortgage History
| Date | Status | Borrower | Loan Amount |
|---|---|---|---|
| Previous Owner | Broughton Michael E | $77,137 |
Source: Public Records
Tax History Compared to Growth
Tax History
| Year | Tax Paid | Tax Assessment Tax Assessment Total Assessment is a certain percentage of the fair market value that is determined by local assessors to be the total taxable value of land and additions on the property. | Land | Improvement |
|---|---|---|---|---|
| 2025 | $556 | $79,936 | $16,149 | $63,787 |
| 2024 | $556 | $79,936 | $16,149 | $63,787 |
| 2023 | $540 | $79,936 | $16,149 | $63,787 |
| 2022 | $532 | $79,936 | $16,149 | $63,787 |
| 2021 | $532 | $79,936 | $16,149 | $63,787 |
| 2020 | $532 | $79,936 | $16,149 | $63,787 |
| 2019 | $551 | $82,891 | $12,638 | $70,253 |
| 2018 | $551 | $0 | $0 | $0 |
| 2017 | $551 | $0 | $0 | $0 |
| 2016 | $545 | $0 | $0 | $0 |
| 2015 | $545 | $82,891 | $12,638 | $70,253 |
| 2014 | $545 | $82,891 | $12,638 | $70,253 |
Source: Public Records
Map
Nearby Homes
- 8288 N Carolina 306
- 45 Osprey Watch E
- 94 Osprey Watch E
- 24 Muscadine Ct
- 562 Mill Creek Rd
- 70 Muscadine Ct
- 76 Chickory Ln
- 1054 Mill Creek Rd
- 705 Mill Creek Rd
- 379 Mill Creek Rd
- 1049 Mill Creek Rd
- 112 Chickory Ln
- 59 Chickory Ln
- 94 Chickory Ln
- 130 Willow Cove Ln
- 203 Wild Cherry Ln
- 69 Wild Cherry Ln
- 956 Mill Creek Rd Unit A
- 78 Snowy Egret Ct
- 89 Willow Cove Ln
- 7587 Kershaw Rd
- 7507 Kershaw Rd
- 7630 Kershaw Rd
- 7494 Kershaw Rd
- 7483 Kershaw Rd
- 7467 Kershaw Rd
- 7682 Kershaw Rd
- 7699 Kershaw Rd
- 7425 Kershaw Rd
- 8183 Nc Highway 306 S
- 8211 N Carolina 306
- 8211 Nc Highway 306 S
- 7728 Kershaw Rd
- 7383 Kershaw Rd
- 8055 N Carolina 306
- 8287 Nc Highway 306
- 7412 N Carolina 306
- 0 N Carolina 306
- 8230 Nc Highway 306 S
- 8315 Nc Highway 306 S