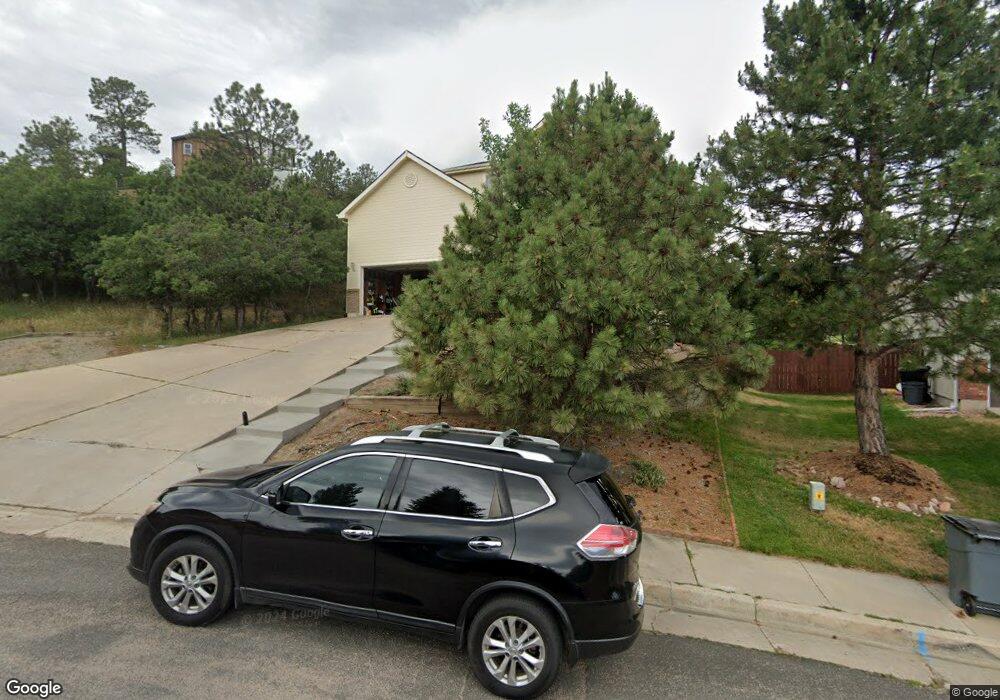
7578 Dry Creek Ln Colorado Springs, CO 80919
Discovery NeighborhoodEstimated Value: $670,000 - $773,000
6
Beds
4
Baths
1,784
Sq Ft
$398/Sq Ft
Est. Value
About This Home
This home is located at 7578 Dry Creek Ln, Colorado Springs, CO 80919 and is currently estimated at $709,934, approximately $397 per square foot. 7578 Dry Creek Ln is a home located in El Paso County with nearby schools including Woodmen-Roberts Elementary School, Eagleview Middle School, and Air Academy High School.
Ownership History
Date
Name
Owned For
Owner Type
Purchase Details
Closed on
Sep 2, 2015
Sold by
Reynolds Ronald J and Reynolds Cleora F
Bought by
Perkins Pamela L
Current Estimated Value
Home Financials for this Owner
Home Financials are based on the most recent Mortgage that was taken out on this home.
Original Mortgage
$337,500
Outstanding Balance
$266,613
Interest Rate
4.08%
Mortgage Type
New Conventional
Estimated Equity
$443,321
Purchase Details
Closed on
Oct 26, 2009
Sold by
Reynolds Ronald J and Reynolds Cleora F
Bought by
Reynolds Ronald J and Reynolds Cleora F
Purchase Details
Closed on
Sep 27, 1995
Sold by
Allure Homes Ltd
Bought by
Reynolds Ronald J and Reynolds Cleora F
Home Financials for this Owner
Home Financials are based on the most recent Mortgage that was taken out on this home.
Original Mortgage
$131,000
Interest Rate
7.88%
Create a Home Valuation Report for This Property
The Home Valuation Report is an in-depth analysis detailing your home's value as well as a comparison with similar homes in the area
Home Values in the Area
Average Home Value in this Area
Purchase History
| Date | Buyer | Sale Price | Title Company |
|---|---|---|---|
| Perkins Pamela L | $375,000 | Land Title Guarantee Company | |
| Reynolds Ronald J | -- | None Available | |
| Reynolds Ronald J | -- | -- |
Source: Public Records
Mortgage History
| Date | Status | Borrower | Loan Amount |
|---|---|---|---|
| Open | Perkins Pamela L | $337,500 | |
| Previous Owner | Reynolds Ronald J | $131,000 |
Source: Public Records
Tax History Compared to Growth
Tax History
| Year | Tax Paid | Tax Assessment Tax Assessment Total Assessment is a certain percentage of the fair market value that is determined by local assessors to be the total taxable value of land and additions on the property. | Land | Improvement |
|---|---|---|---|---|
| 2025 | $2,484 | $45,560 | -- | -- |
| 2024 | $2,458 | $42,850 | $6,030 | $36,820 |
| 2022 | $2,200 | $31,520 | $5,420 | $26,100 |
| 2021 | $2,435 | $32,430 | $5,580 | $26,850 |
| 2020 | $2,354 | $29,200 | $4,860 | $24,340 |
| 2019 | $2,330 | $29,200 | $4,860 | $24,340 |
| 2018 | $2,136 | $26,330 | $4,680 | $21,650 |
| 2017 | $2,128 | $26,330 | $4,680 | $21,650 |
| 2016 | $2,029 | $25,070 | $3,980 | $21,090 |
| 2015 | $1,275 | $23,750 | $3,980 | $19,770 |
| 2014 | $1,151 | $22,200 | $3,860 | $18,340 |
Source: Public Records
Map
Nearby Homes
- 1255 Dancing Horse Dr
- 7835 Delmonico Dr
- 1360 Dancing Horse Dr
- 7315 Wynwood Terrace
- 1210 W Woodmen Rd
- 1370 Dancing Horse Dr
- 1240 Oak Hills Dr
- 7665 Calloway Ct
- 7470 Colton Bluffs View
- 1260 Timber Valley Rd
- 570 Big Valley Dr
- 1680 Doe Run Point
- 7049 Oak Valley Dr
- 1595 Oak Hills Dr
- 7780 Fawn Meadow View
- 6825 Oak Valley Ln
- 7074 Oak Valley Dr
- 706 Belleza View
- 712 Belleza View
- 718 Belleza View
- 7586 Dry Creek Ln
- 7570 Dry Creek Ln
- 7550 Dry Creek Ln
- 1135 Carlson Dr
- 1225 Carlson Dr
- 1235 Carlson Dr
- 1125 Carlson Dr
- 7530 Dry Creek Ln
- 7565 Dry Creek Ln
- 7510 Dry Creek Ln
- 7545 Dry Creek Ln
- 1160 Carlson Dr
- 1150 Carlson Dr
- 1170 Carlson Dr
- 1140 Carlson Dr
- 1180 Carlson Dr
- 7525 Dry Creek Ln
- 1105 Carlson Dr
- 1130 Carlson Dr
- 1210 Carlson Dr