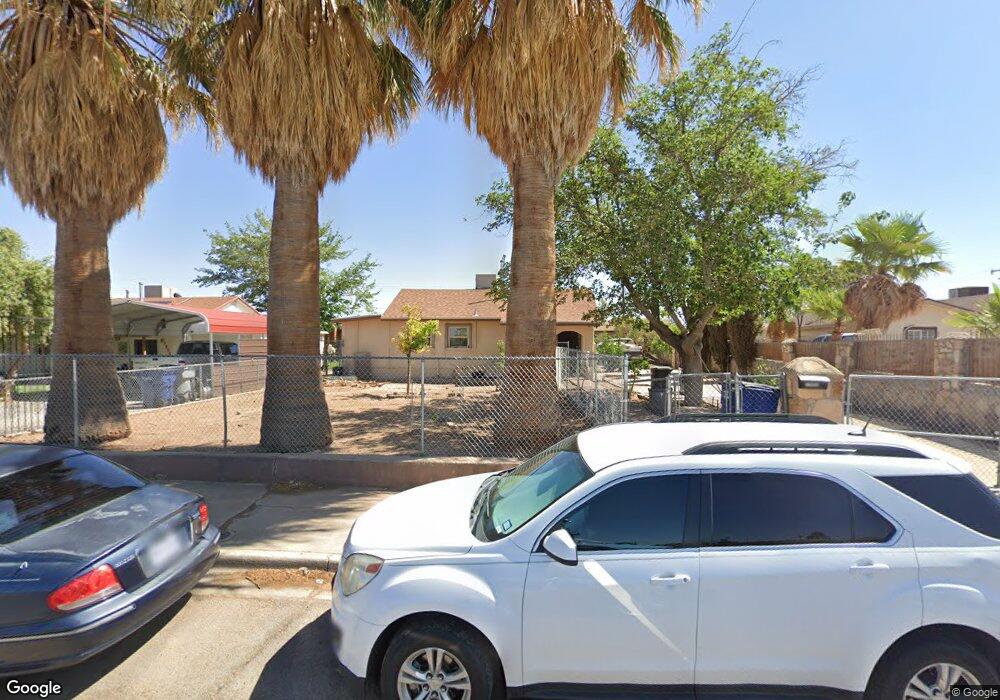
7579 Adobe Dr El Paso, TX 79915
Hacienda Heights NeighborhoodEstimated Value: $189,000 - $217,016
--
Bed
2
Baths
2,305
Sq Ft
$91/Sq Ft
Est. Value
About This Home
This home is located at 7579 Adobe Dr, El Paso, TX 79915 and is currently estimated at $209,254, approximately $90 per square foot. 7579 Adobe Dr is a home located in El Paso County with nearby schools including Hacienda Heights Elementary School, North Loop Elementary School, and Bel Air Middle.
Ownership History
Date
Name
Owned For
Owner Type
Purchase Details
Closed on
Aug 20, 2024
Sold by
Flores Jesus Jose
Bought by
Flores Yvette
Current Estimated Value
Purchase Details
Closed on
Aug 1, 2024
Sold by
Flores Yvette
Bought by
Barraza Vanessa Marie and Barraza Gregory Robert
Purchase Details
Closed on
Apr 4, 2021
Sold by
Flores Hector T
Bought by
Flores Yvette
Purchase Details
Closed on
Oct 15, 2015
Sold by
Flores Amparo C
Bought by
Flores Amparo C and Flores Hector T
Purchase Details
Closed on
Dec 16, 1997
Sold by
Flores Hector T
Bought by
Flores Salvador T
Purchase Details
Closed on
Aug 14, 1997
Sold by
Bohling Ida
Bought by
Flores Juan Jose
Home Financials for this Owner
Home Financials are based on the most recent Mortgage that was taken out on this home.
Original Mortgage
$70,000
Interest Rate
7.6%
Mortgage Type
Seller Take Back
Purchase Details
Closed on
Jun 17, 1994
Sold by
Samaniego Leo
Bought by
Flores Amparo C
Create a Home Valuation Report for This Property
The Home Valuation Report is an in-depth analysis detailing your home's value as well as a comparison with similar homes in the area
Home Values in the Area
Average Home Value in this Area
Purchase History
| Date | Buyer | Sale Price | Title Company |
|---|---|---|---|
| Flores Yvette | -- | None Listed On Document | |
| Barraza Vanessa Marie | -- | None Listed On Document | |
| Flores Yvette | -- | None Available | |
| Flores Amparo C | -- | None Available | |
| Flores Salvador T | -- | -- | |
| Flores Juan Jose | -- | -- | |
| Flores Amparo C | -- | -- |
Source: Public Records
Mortgage History
| Date | Status | Borrower | Loan Amount |
|---|---|---|---|
| Previous Owner | Flores Juan Jose | $70,000 |
Source: Public Records
Tax History Compared to Growth
Tax History
| Year | Tax Paid | Tax Assessment Tax Assessment Total Assessment is a certain percentage of the fair market value that is determined by local assessors to be the total taxable value of land and additions on the property. | Land | Improvement |
|---|---|---|---|---|
| 2025 | $2,376 | $207,255 | -- | -- |
| 2024 | $2,376 | $188,414 | -- | -- |
| 2023 | $2,275 | $171,285 | $13,700 | $157,585 |
| 2022 | $4,965 | $159,897 | $13,700 | $146,197 |
| 2021 | $3,584 | $145,204 | $13,700 | $131,504 |
| 2020 | $3,166 | $100,237 | $13,700 | $86,537 |
| 2018 | $3,092 | $99,430 | $13,700 | $85,730 |
| 2017 | $2,961 | $96,864 | $13,700 | $83,164 |
| 2016 | $2,961 | $96,864 | $13,700 | $83,164 |
| 2015 | $1,587 | $96,864 | $13,700 | $83,164 |
| 2014 | $1,587 | $100,958 | $13,700 | $87,258 |
Source: Public Records
Map
Nearby Homes
- 7542 Hermosillo Dr
- 3 Atkinson Way
- 7556 N Loop Dr
- 7655 Hacienda Ave
- 7534 Taxco Dr
- 423 N Carolina Dr
- 7718 Parral Dr
- 7622 Matamoros Dr
- 7564 Matamoros Dr
- 443 Cadwallader Dr
- 7800 Hermosillo Dr
- 7713 Matamoros Dr
- 537 Emerson St
- 1121 Belen Rd
- 7632 Franklin Dr Unit 1-2
- 7761 Maverick Ave
- 1124 Hunter Dr
- 812 Santa Barbara Dr
- 7832 Ranchland Dr
- 844 Santa Barbara Dr
- 7575 Adobe Dr
- 7585 Adobe Dr
- 7578 Hacienda Ave
- 7569 Adobe Dr
- 7582 Hacienda Ave
- 7574 Hacienda Ave
- 7572 Adobe Dr Unit 7576
- 7591 Adobe Dr
- 7570 Hacienda Ave
- 7588 Hacienda Ave
- 7582 Adobe Dr
- 7586 Adobe Dr
- 7566 Hacienda Ave
- 7570 Adobe Dr
- 7563 Adobe Dr
- 7592 Hacienda Ave
- 7593 Adobe Dr
- 7590 Adobe Dr
- 7566 Adobe Dr
- 7562 Hacienda Ave