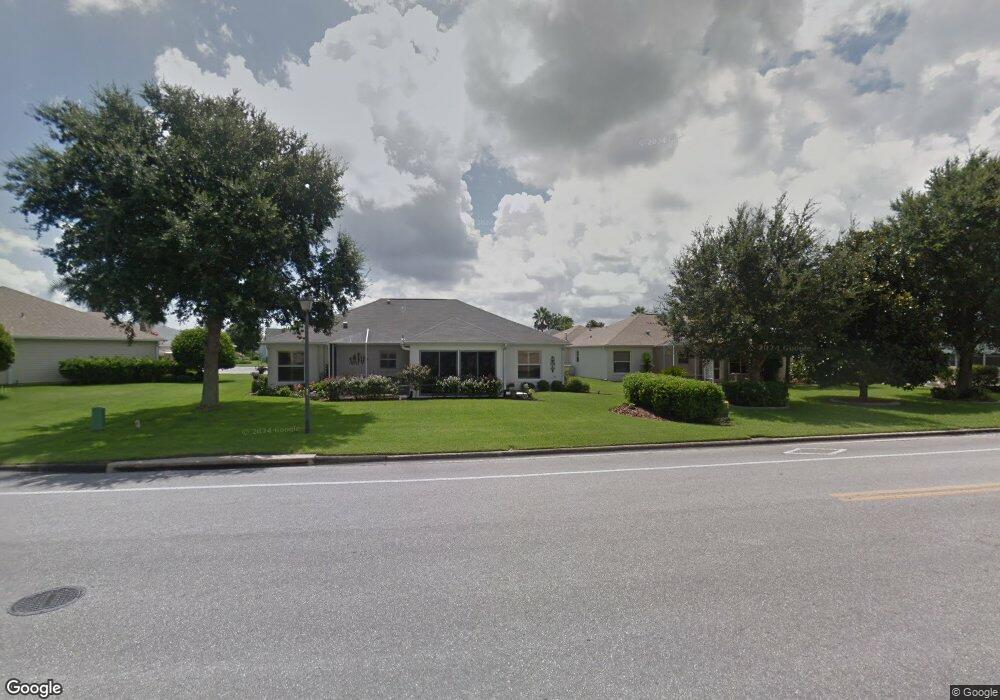
758 Manning Place The Villages, FL 32162
Village of Polo Ridge NeighborhoodEstimated Value: $341,000 - $400,000
--
Bed
--
Bath
1,593
Sq Ft
$229/Sq Ft
Est. Value
About This Home
This home is located at 758 Manning Place, The Villages, FL 32162 and is currently estimated at $364,396, approximately $228 per square foot. 758 Manning Place is a home located in Sumter County with nearby schools including Wildwood Elementary School, Wildwood Middle/High School, and Villages Charter School.
Ownership History
Date
Name
Owned For
Owner Type
Purchase Details
Closed on
Jul 28, 2022
Sold by
E Gene And Donna L Cote Revocable Living
Bought by
Moore Ronald E and Moore Janet Z
Current Estimated Value
Home Financials for this Owner
Home Financials are based on the most recent Mortgage that was taken out on this home.
Original Mortgage
$288,000
Outstanding Balance
$275,753
Interest Rate
5.7%
Mortgage Type
New Conventional
Estimated Equity
$88,643
Purchase Details
Closed on
Feb 3, 2006
Sold by
Cote E Gene and Cote Donna L
Bought by
Cote E Gene and Cote Donna L
Purchase Details
Closed on
Nov 9, 2004
Sold by
Vrioni James and Vrioni Leslie E
Bought by
Cote E Gene and Cote Donna L
Purchase Details
Closed on
Oct 22, 2001
Sold by
Villages Lake Sumter Inc
Bought by
Vrioni James and Vrioni Leslie E
Home Financials for this Owner
Home Financials are based on the most recent Mortgage that was taken out on this home.
Original Mortgage
$141,500
Interest Rate
6.74%
Create a Home Valuation Report for This Property
The Home Valuation Report is an in-depth analysis detailing your home's value as well as a comparison with similar homes in the area
Home Values in the Area
Average Home Value in this Area
Purchase History
| Date | Buyer | Sale Price | Title Company |
|---|---|---|---|
| Moore Ronald E | $360,000 | Peninsula Land & Title | |
| Cote E Gene | -- | None Available | |
| Cote E Gene | $226,000 | -- | |
| Vrioni James | $178,500 | -- |
Source: Public Records
Mortgage History
| Date | Status | Borrower | Loan Amount |
|---|---|---|---|
| Open | Moore Ronald E | $288,000 | |
| Previous Owner | Vrioni James | $141,500 |
Source: Public Records
Tax History Compared to Growth
Tax History
| Year | Tax Paid | Tax Assessment Tax Assessment Total Assessment is a certain percentage of the fair market value that is determined by local assessors to be the total taxable value of land and additions on the property. | Land | Improvement |
|---|---|---|---|---|
| 2024 | $3,175 | $307,620 | -- | -- |
| 2023 | $3,175 | $298,660 | $31,640 | $267,020 |
| 2022 | $2,285 | $209,170 | $0 | $0 |
| 2021 | $2,411 | $203,080 | $0 | $0 |
| 2020 | $2,458 | $200,280 | $0 | $0 |
| 2019 | $2,457 | $195,780 | $0 | $0 |
| 2018 | $2,520 | $192,130 | $0 | $0 |
| 2017 | $2,482 | $188,180 | $0 | $0 |
| 2016 | $2,506 | $184,310 | $0 | $0 |
| 2015 | $2,532 | $183,030 | $0 | $0 |
| 2014 | $2,528 | $181,580 | $0 | $0 |
Source: Public Records
Map
Nearby Homes
- 3165 Mansfield St
- 3141 Mansfield St
- 3243 Mansfield St
- 3213 Archer Ave
- 766 Artesia Ave Unit 35
- 987 Candler Place
- 3277 Ashbrook Place
- 2169 Smoaks St
- 3460 Idlewood Loop
- 3032 Bridgefield Ct Unit 34
- 3657 Cambria Cir
- 2117 Smoaks St
- 3294 Shelby St
- 870 Henderson Ln
- 3288 Oakdale Place
- 3604 Cambria Cir
- 3472 Sipsey St
- 3467 Sipsey St
- 2108 Clarks Hill Way
- 12185 NE 51st Cir
- 754 Manning Place
- 762 Manning Place
- 750 Manning Place
- 766 Manning Place
- 3177 Williams Rd
- 757 Manning Place
- 765 Manning Place
- 761 Manning Place
- 3195 Southern Trace
- 3206 Woodridge Dr
- 749 Taos Way
- 3187 Southern Trace
- 3171 Williams Rd
- 3188 Hudson Ct
- 3194 Hudson Ct
- 3182 Hudson Ct
- 743 Taos Way
- 768 Huey Ln
- 3188 Williams Rd