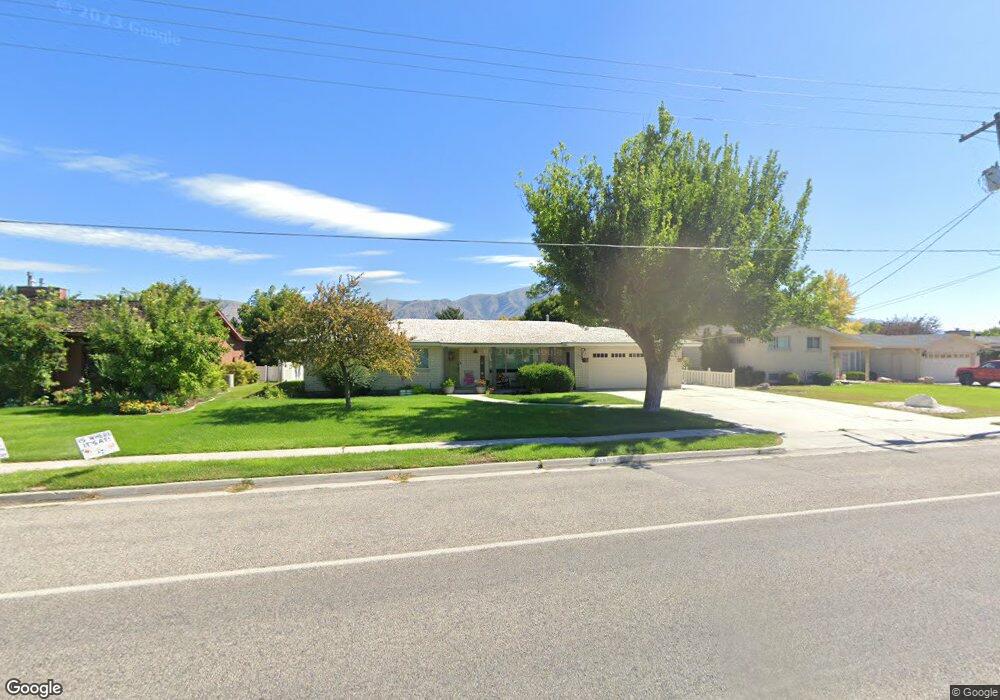
758 N 300 E Tremonton, UT 84337
Estimated Value: $401,000 - $440,000
3
Beds
2
Baths
1,873
Sq Ft
$226/Sq Ft
Est. Value
About This Home
This home is located at 758 N 300 E, Tremonton, UT 84337 and is currently estimated at $423,196, approximately $225 per square foot. 758 N 300 E is a home located in Box Elder County with nearby schools including North Park School, Bear River Middle School, and Alice C. Harris Intermediate School.
Ownership History
Date
Name
Owned For
Owner Type
Purchase Details
Closed on
Apr 23, 2015
Sold by
Dursteler Dixie and Davis Cheryl
Bought by
Balley M Wayne and Balley Heidi M
Current Estimated Value
Home Financials for this Owner
Home Financials are based on the most recent Mortgage that was taken out on this home.
Original Mortgage
$168,547
Outstanding Balance
$129,277
Interest Rate
3.64%
Mortgage Type
VA
Estimated Equity
$293,919
Purchase Details
Closed on
Dec 27, 2012
Sold by
Fuhriman Evelyn H
Bought by
Dursteler Dixie and Davis Cheryl
Purchase Details
Closed on
May 23, 2005
Sold by
J E M M Investments Llc
Bought by
Bella Vista Lending Llc
Create a Home Valuation Report for This Property
The Home Valuation Report is an in-depth analysis detailing your home's value as well as a comparison with similar homes in the area
Home Values in the Area
Average Home Value in this Area
Purchase History
We collect this data history from publicly available records. To have your information removed, we recommend requesting removal directly through your county’s website.
| Date | Buyer | Sale Price | Title Company |
|---|---|---|---|
| Balley M Wayne | -- | Northern Title Co | |
| Dursteler Dixie | -- | None Available | |
| Bella Vista Lending Llc | -- | None Available |
Source: Public Records
Mortgage History
We collect this data history from publicly available records. To have your information removed, we recommend requesting removal directly through your county’s website.
| Date | Status | Borrower | Loan Amount |
|---|---|---|---|
| Open | Balley M Wayne | $168,547 |
Source: Public Records
Tax History
| Year | Tax Paid | Tax Assessment Tax Assessment Total Assessment is a certain percentage of the fair market value that is determined by local assessors to be the total taxable value of land and additions on the property. | Land | Improvement |
|---|---|---|---|---|
| 2025 | $2,741 | $426,488 | $150,000 | $276,488 |
| 2024 | $2,465 | $426,828 | $150,000 | $276,828 |
| 2023 | $2,606 | $443,054 | $155,000 | $288,054 |
| 2022 | $1,990 | $192,953 | $24,750 | $168,203 |
| 2021 | $1,797 | $243,256 | $45,000 | $198,256 |
| 2020 | $1,579 | $243,256 | $45,000 | $198,256 |
| 2019 | $1,476 | $121,246 | $24,750 | $96,496 |
| 2018 | $1,333 | $100,023 | $24,008 | $76,015 |
| 2017 | $1,377 | $181,859 | $24,008 | $138,209 |
| 2016 | $1,359 | $96,403 | $24,008 | $72,395 |
| 2015 | -- | $89,822 | $24,008 | $65,814 |
| 2014 | -- | $86,688 | $24,008 | $62,680 |
| 2013 | -- | $86,688 | $24,008 | $62,680 |
Source: Public Records
Map
Nearby Homes
Your Personal Tour Guide
Ask me questions while you tour the home.