Estimated Value: $579,000 - $634,000
5
Beds
3
Baths
1,214
Sq Ft
$501/Sq Ft
Est. Value
About This Home
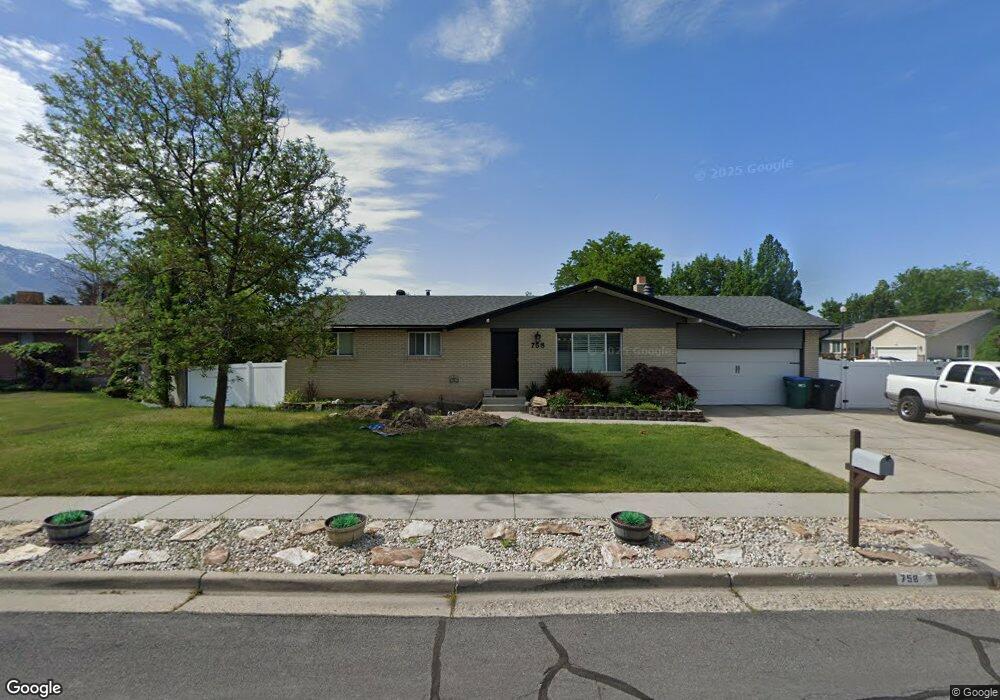
This home is located at 758 Pinewood Cir, Sandy, UT 84094 and is currently estimated at $608,291, approximately $501 per square foot. 758 Pinewood Cir is a home located in Salt Lake County with nearby schools including East Sandy School, Union Middle School, and Hillcrest High School.
Ownership History
Date
Name
Owned For
Owner Type
Purchase Details
Closed on
Apr 26, 2021
Sold by
Pearson Jeremy T and Pearson Kristy M
Bought by
Pearson Jeremy Trent and Pearson Kristy M
Current Estimated Value
Home Financials for this Owner
Home Financials are based on the most recent Mortgage that was taken out on this home.
Original Mortgage
$278,000
Outstanding Balance
$210,075
Interest Rate
3%
Mortgage Type
New Conventional
Estimated Equity
$398,216
Purchase Details
Closed on
Oct 16, 2013
Sold by
Jackson Torey
Bought by
Pearson Jeremy T and Pearson Kristy M
Home Financials for this Owner
Home Financials are based on the most recent Mortgage that was taken out on this home.
Original Mortgage
$207,000
Interest Rate
4.55%
Mortgage Type
FHA
Purchase Details
Closed on
May 20, 2003
Sold by
Jackson Torey and Jackson Claudia
Bought by
Jackson Torey
Home Financials for this Owner
Home Financials are based on the most recent Mortgage that was taken out on this home.
Original Mortgage
$158,137
Interest Rate
5.77%
Mortgage Type
FHA
Purchase Details
Closed on
Nov 19, 2002
Sold by
Jackson Torey and Jackson Claudia
Bought by
Jackson Torey
Home Financials for this Owner
Home Financials are based on the most recent Mortgage that was taken out on this home.
Original Mortgage
$158,137
Interest Rate
5.89%
Mortgage Type
FHA
Purchase Details
Closed on
May 9, 2002
Sold by
Jackson Torey
Bought by
Jackson Torey and Jackson Claudia
Purchase Details
Closed on
Oct 18, 2001
Sold by
Yorgason Ty C
Bought by
Jackson Torey
Home Financials for this Owner
Home Financials are based on the most recent Mortgage that was taken out on this home.
Original Mortgage
$158,137
Interest Rate
6.88%
Mortgage Type
FHA
Purchase Details
Closed on
Oct 20, 1999
Sold by
Peterson Andrew A and Peterson Laura V
Bought by
Yorgason Ty C
Home Financials for this Owner
Home Financials are based on the most recent Mortgage that was taken out on this home.
Original Mortgage
$124,800
Interest Rate
7.25%
Purchase Details
Closed on
Feb 27, 1996
Sold by
Guymon Norma Christine
Bought by
Peterson Andrew A and Peterson Laura
Home Financials for this Owner
Home Financials are based on the most recent Mortgage that was taken out on this home.
Original Mortgage
$129,600
Interest Rate
7.04%
Create a Home Valuation Report for This Property
The Home Valuation Report is an in-depth analysis detailing your home's value as well as a comparison with similar homes in the area
Home Values in the Area
Average Home Value in this Area
Purchase History
| Date | Buyer | Sale Price | Title Company |
|---|---|---|---|
| Pearson Jeremy Trent | -- | First American Title | |
| Pearson Jeremy T | -- | Title Guarantee | |
| Jackson Torey | -- | First American Title | |
| Jackson Torey | -- | First American Title | |
| Jackson Torey | -- | First American Title | |
| Jackson Torey | -- | Associated Title | |
| Yorgason Ty C | -- | Inwest Title Services | |
| Peterson Andrew A | -- | -- |
Source: Public Records
Mortgage History
| Date | Status | Borrower | Loan Amount |
|---|---|---|---|
| Open | Pearson Jeremy Trent | $278,000 | |
| Closed | Pearson Jeremy T | $207,000 | |
| Previous Owner | Jackson Torey | $158,137 | |
| Previous Owner | Jackson Torey | $158,137 | |
| Previous Owner | Jackson Torey | $158,137 | |
| Previous Owner | Yorgason Ty C | $124,800 | |
| Previous Owner | Peterson Andrew A | $129,600 |
Source: Public Records
Tax History
| Year | Tax Paid | Tax Assessment Tax Assessment Total Assessment is a certain percentage of the fair market value that is determined by local assessors to be the total taxable value of land and additions on the property. | Land | Improvement |
|---|---|---|---|---|
| 2025 | $3,048 | $559,600 | $167,400 | $392,200 |
| 2024 | $3,048 | $563,000 | $161,000 | $402,000 |
| 2023 | $3,012 | $554,900 | $153,000 | $401,900 |
| 2022 | $2,937 | $529,000 | $150,000 | $379,000 |
| 2021 | $2,474 | $378,600 | $116,600 | $262,000 |
| 2020 | $2,399 | $346,500 | $116,600 | $229,900 |
| 2019 | $2,271 | $319,400 | $110,000 | $209,400 |
| 2018 | $2,105 | $308,800 | $110,000 | $198,800 |
| 2017 | $2,034 | $284,800 | $110,000 | $174,800 |
| 2016 | $2,010 | $272,000 | $110,000 | $162,000 |
| 2015 | $2,038 | $255,800 | $132,400 | $123,400 |
| 2014 | $1,876 | $231,200 | $121,300 | $109,900 |
Source: Public Records
Map
Nearby Homes
- 8023 S Pinewood Dr
- 798 E Spruce Tree Ln
- 7819 S Spruce Tree Ln
- 760 E 8080 S
- 8087 S 615 E
- 600 E Briarsprings Cir
- 687 E Orchard Vista Ct
- 8268 S 865 E
- 393 E Corral Creek Dr
- 397 E Tractor Dr
- 8260 S 560 E
- 379 E Horse Creek Dr
- 7579 S 520 E
- 8223 S 1000 E
- 8322 S Levine Ln Unit 111
- 744 E 8425 S
- 354 E 7635 South St
- 7824 S 280 E
- 350 E 7635 South St
- 7755 S 1130 E
- 758 E Pinewood Cir
- 770 Pinewood Cir
- 7955 Pinewood Dr
- 7955 S Pinewood Dr
- 770 E Pinewood Cir
- 771 E Cedar Terrace Dr
- 771 Cedar Terrace Dr
- 7944 Pinewood Dr
- 7954 Pinewood Dr
- 7917 Pinewood Dr
- 7934 Pinewood Dr
- 7954 S Pinewood Dr
- 773 Pinewood Cir
- 780 Pinewood Cir
- 780 E Pinewood Cir
- 7918 Pinewood Dr
- 779 Cedar Terrace Dr
- 7966 Pinewood Dr
- 7966 S Pinewood Dr
- 781 Pinewood Cir
Your Personal Tour Guide
Ask me questions while you tour the home.