Estimated Value: $156,000 - $184,000
4
Beds
2
Baths
1,856
Sq Ft
$91/Sq Ft
Est. Value
About This Home
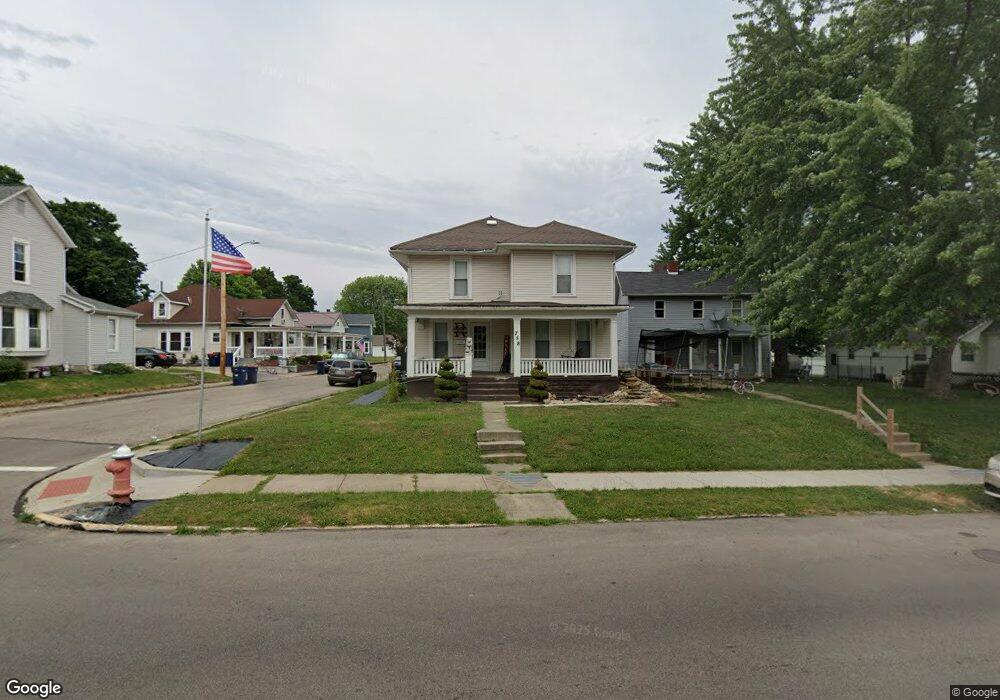
This home is located at 758 South St, Piqua, OH 45356 and is currently estimated at $169,148, approximately $91 per square foot. 758 South St is a home located in Miami County with nearby schools including Piqua Junior High School, Piqua High School, and Nicholas School.
Ownership History
Date
Name
Owned For
Owner Type
Purchase Details
Closed on
Aug 19, 2008
Sold by
Kendall F John
Bought by
Rudy Joshua M
Current Estimated Value
Home Financials for this Owner
Home Financials are based on the most recent Mortgage that was taken out on this home.
Original Mortgage
$57,103
Outstanding Balance
$37,588
Interest Rate
6.39%
Mortgage Type
FHA
Estimated Equity
$131,560
Purchase Details
Closed on
Jan 14, 2003
Sold by
Kendall Karen S and Luring Roger E
Bought by
Kendall F John
Purchase Details
Closed on
Apr 15, 1991
Bought by
Kendall F John
Create a Home Valuation Report for This Property
The Home Valuation Report is an in-depth analysis detailing your home's value as well as a comparison with similar homes in the area
Home Values in the Area
Average Home Value in this Area
Purchase History
| Date | Buyer | Sale Price | Title Company |
|---|---|---|---|
| Rudy Joshua M | $58,000 | -- | |
| Kendall F John | -- | -- | |
| Kendall F John | $39,200 | -- |
Source: Public Records
Mortgage History
| Date | Status | Borrower | Loan Amount |
|---|---|---|---|
| Open | Kendall F John | $57,103 |
Source: Public Records
Tax History
| Year | Tax Paid | Tax Assessment Tax Assessment Total Assessment is a certain percentage of the fair market value that is determined by local assessors to be the total taxable value of land and additions on the property. | Land | Improvement |
|---|---|---|---|---|
| 2024 | $2,149 | $36,970 | $6,340 | $30,630 |
| 2023 | $1,519 | $36,970 | $6,340 | $30,630 |
| 2022 | $1,546 | $36,970 | $6,340 | $30,630 |
| 2021 | $1,251 | $27,370 | $4,690 | $22,680 |
| 2020 | $1,226 | $27,370 | $4,690 | $22,680 |
| 2019 | $1,233 | $27,370 | $4,690 | $22,680 |
| 2018 | $1,162 | $24,640 | $4,690 | $19,950 |
| 2017 | $1,177 | $24,640 | $4,690 | $19,950 |
| 2016 | $1,164 | $24,640 | $4,690 | $19,950 |
| 2015 | $1,145 | $23,700 | $4,520 | $19,180 |
| 2014 | $1,145 | $23,700 | $4,520 | $19,180 |
| 2013 | $1,149 | $23,700 | $4,520 | $19,180 |
Source: Public Records
Map
Nearby Homes
Your Personal Tour Guide
Ask me questions while you tour the home.