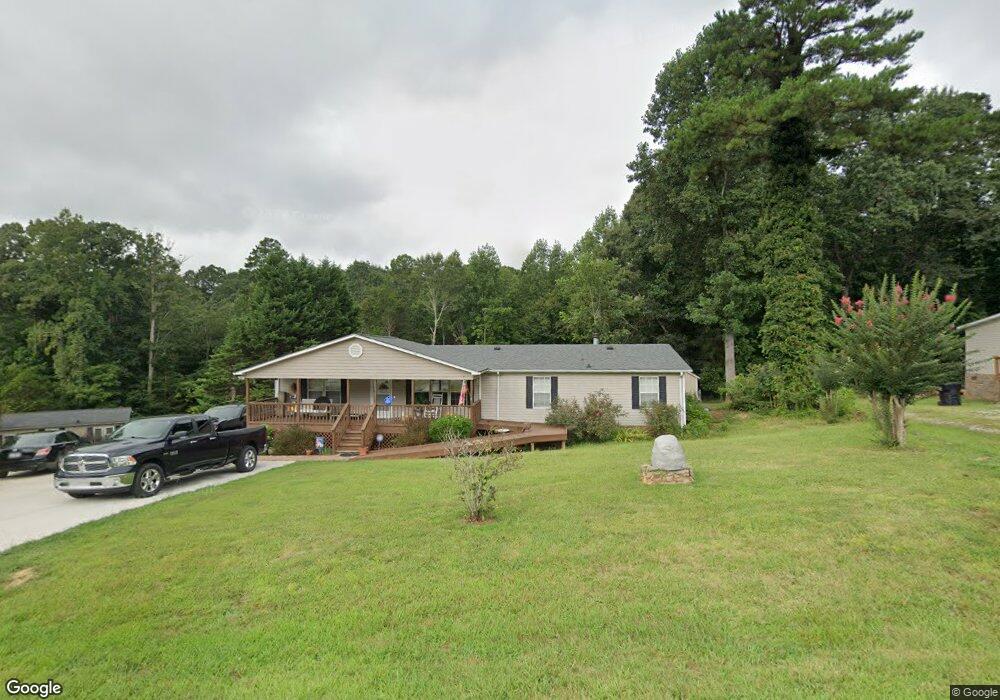
758 Spring Creek Dr Iron Station, NC 28080
Estimated Value: $219,000 - $253,000
4
Beds
2
Baths
1,620
Sq Ft
$143/Sq Ft
Est. Value
About This Home
This home is located at 758 Spring Creek Dr, Iron Station, NC 28080 and is currently estimated at $232,203, approximately $143 per square foot. 758 Spring Creek Dr is a home located in Lincoln County with nearby schools including Catawba Springs Elementary School, East Lincoln Middle School, and East Lincoln High School.
Ownership History
Date
Name
Owned For
Owner Type
Purchase Details
Closed on
Mar 26, 2010
Sold by
Secretary Of Housing & Urban Development
Bought by
Overcash Amanda M
Current Estimated Value
Purchase Details
Closed on
Nov 19, 2009
Sold by
Wells Fargo Bank Na
Bought by
Secretary Of Housing & Urban Development
Purchase Details
Closed on
Sep 17, 2009
Sold by
Alwran Dwight Wayne
Bought by
Wells Fargo Bank Na
Purchase Details
Closed on
Aug 18, 2004
Bought by
Alwran Dwight Wayne
Purchase Details
Closed on
Oct 31, 2003
Bought by
Primestar Properties Inc
Purchase Details
Closed on
Mar 13, 2001
Bought by
Robinson Elliot A and Robinson Lisa M
Purchase Details
Closed on
Jun 10, 1996
Bought by
Henderson Robin Mcdowell and Henderson Gunther
Create a Home Valuation Report for This Property
The Home Valuation Report is an in-depth analysis detailing your home's value as well as a comparison with similar homes in the area
Home Values in the Area
Average Home Value in this Area
Purchase History
| Date | Buyer | Sale Price | Title Company |
|---|---|---|---|
| Overcash Amanda M | -- | None Available | |
| Secretary Of Housing & Urban Development | -- | None Available | |
| Wells Fargo Bank Na | $111,099 | None Available | |
| Alwran Dwight Wayne | $25,000 | -- | |
| Primestar Properties Inc | $18,000 | -- | |
| Robinson Elliot A | $25,000 | -- | |
| Henderson Robin Mcdowell | $10,500 | -- |
Source: Public Records
Tax History Compared to Growth
Tax History
| Year | Tax Paid | Tax Assessment Tax Assessment Total Assessment is a certain percentage of the fair market value that is determined by local assessors to be the total taxable value of land and additions on the property. | Land | Improvement |
|---|---|---|---|---|
| 2025 | $1,349 | $195,332 | $33,465 | $161,867 |
| 2024 | $1,329 | $195,332 | $33,465 | $161,867 |
| 2023 | $1,123 | $166,415 | $33,465 | $132,950 |
| 2022 | $893 | $105,771 | $27,372 | $78,399 |
| 2021 | $893 | $105,771 | $27,372 | $78,399 |
| 2020 | $757 | $105,771 | $27,372 | $78,399 |
| 2019 | $757 | $105,771 | $27,372 | $78,399 |
| 2018 | $759 | $90,473 | $24,872 | $65,601 |
| 2017 | $658 | $90,473 | $24,872 | $65,601 |
| 2016 | $658 | $90,473 | $24,872 | $65,601 |
| 2015 | $731 | $90,473 | $24,872 | $65,601 |
| 2014 | $717 | $89,603 | $29,452 | $60,151 |
Source: Public Records
Map
Nearby Homes
- 1785 Doe Ct
- 1789 Doe Ct
- 0 Oak Park Ct Unit 17
- 1615 Oak Park Ct
- 1713 Oak Park Ct
- 0 Highway 73 Hwy Unit CAR4276388
- 5716 Dalmatian St
- 0 Wolf Rd Unit 8
- 450 Greywalls Ln
- 5039 Penn Rd
- 5748 Dalmatian St
- 5756 Dalmatian St
- Lot #42 Sardis Ct
- 0 Lhasa Apso Ln Unit CAR4157960
- 0 Lhasa Apso Ln Unit CAR4157956
- 0 Dalmatian St Unit CAR4157812
- 5843 Dachshund St
- 0 Great Dane Ave Unit CAR4157929
- 5756 Rumfelt Rd
- 0 Mariposa Rd Unit CAR4237549
- 748 Spring Creek Dr
- 734 Spring Creek Dr
- 765 Spring Creek Dr
- 739 Spring Creek Dr
- 768 Spring Creek Dr
- 720 Spring Creek Dr
- 774 Spring Creek Dr
- 5730 High Plains Ct
- 721 Spring Creek Dr
- 775 Spring Creek Dr
- 5739 High Plains Ct
- 767 Mount Zion Church Rd
- 815 Mount Zion Church Rd
- 715 Spring Creek Dr
- 5745 High Plains Ct
- 5732 High Plains Ct
- 832 Monterey Dr
- 818 Monterey Dr
- 5753 High Plains Ct
- 5748 High Plains Ct