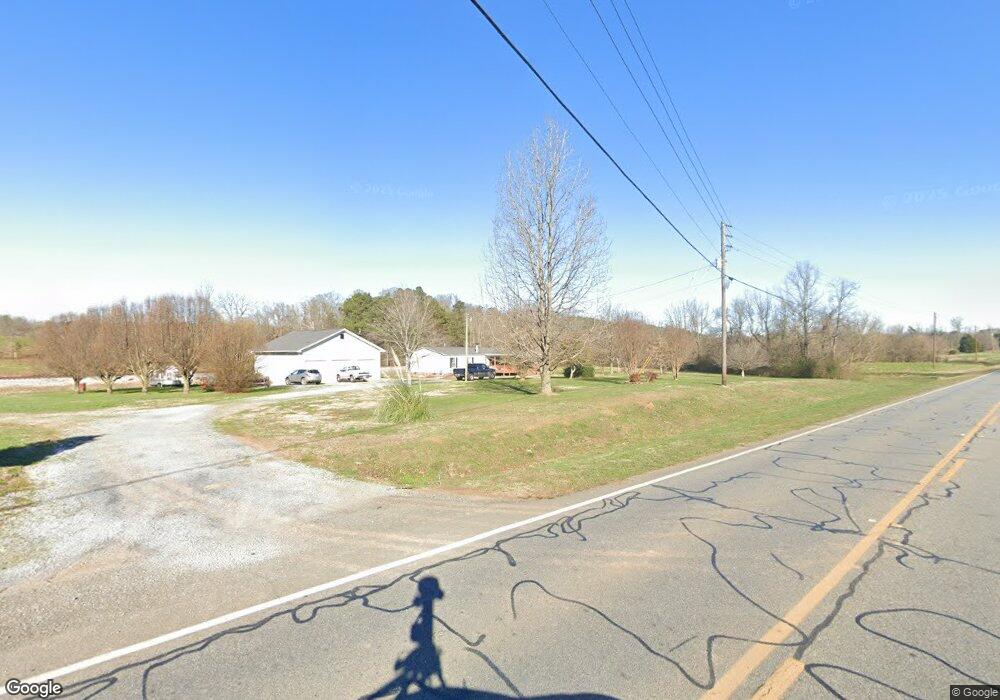
758 Us Highway 411 NE Ranger, GA 30734
Estimated Value: $192,000 - $402,000
4
Beds
2
Baths
2,240
Sq Ft
$144/Sq Ft
Est. Value
About This Home
This home is located at 758 Us Highway 411 NE, Ranger, GA 30734 and is currently estimated at $321,943, approximately $143 per square foot. 758 Us Highway 411 NE is a home located in Gordon County with nearby schools including Fairmount Elementary School, Red Bud Middle School, and Sonoraville High School.
Ownership History
Date
Name
Owned For
Owner Type
Purchase Details
Closed on
Sep 26, 2018
Sold by
Motes Vernie
Bought by
Stone Tommie Joe and Stone Mary Ann
Current Estimated Value
Home Financials for this Owner
Home Financials are based on the most recent Mortgage that was taken out on this home.
Original Mortgage
$130,000
Outstanding Balance
$97,458
Interest Rate
4.5%
Mortgage Type
New Conventional
Estimated Equity
$224,485
Purchase Details
Closed on
Sep 26, 2011
Sold by
Federal National Mortgage Association
Bought by
Motes Vernie
Purchase Details
Closed on
Apr 6, 2010
Sold by
Walling Buford D and Walling Claudia J
Bought by
Bac Home Loans Servicing Fka Countrywide
Purchase Details
Closed on
May 7, 2003
Sold by
Walling Buford D
Bought by
Walling Buford D and Walling Claudia J
Purchase Details
Closed on
Sep 7, 1999
Bought by
Greentree Fin Serv Corp
Purchase Details
Closed on
Oct 2, 1997
Bought by
Young Rammy and Young Randy G
Purchase Details
Closed on
Feb 22, 1900
Bought by
Millwood Cynthia
Create a Home Valuation Report for This Property
The Home Valuation Report is an in-depth analysis detailing your home's value as well as a comparison with similar homes in the area
Home Values in the Area
Average Home Value in this Area
Purchase History
| Date | Buyer | Sale Price | Title Company |
|---|---|---|---|
| Stone Tommie Joe | $130,000 | -- | |
| Motes Vernie | $42,600 | -- | |
| Bac Home Loans Servicing Fka Countrywide | $72,500 | -- | |
| Walling Buford D | -- | -- | |
| Walling Buford D | $100,000 | -- | |
| Greentree Fin Serv Corp | -- | -- | |
| Young Rammy | $19,200 | -- | |
| Millwood Cynthia | $78,900 | -- |
Source: Public Records
Mortgage History
| Date | Status | Borrower | Loan Amount |
|---|---|---|---|
| Open | Stone Tommie Joe | $130,000 |
Source: Public Records
Tax History Compared to Growth
Tax History
| Year | Tax Paid | Tax Assessment Tax Assessment Total Assessment is a certain percentage of the fair market value that is determined by local assessors to be the total taxable value of land and additions on the property. | Land | Improvement |
|---|---|---|---|---|
| 2024 | $625 | $73,160 | $17,120 | $56,040 |
| 2023 | $592 | $69,480 | $17,120 | $52,360 |
| 2022 | $580 | $65,000 | $17,120 | $47,880 |
| 2021 | $490 | $55,520 | $17,120 | $38,400 |
| 2020 | $500 | $56,120 | $17,120 | $39,000 |
| 2019 | $462 | $56,120 | $17,120 | $39,000 |
| 2018 | $279 | $32,978 | $17,120 | $15,858 |
| 2017 | $285 | $32,978 | $17,120 | $15,858 |
| 2016 | $286 | $32,978 | $17,120 | $15,858 |
| 2015 | $304 | $34,577 | $17,120 | $17,458 |
| 2014 | $299 | $34,665 | $17,128 | $17,537 |
Source: Public Records
Map
Nearby Homes
- 00 Highway 411
- 1001 Liberty Church Rd NE
- 1328 Birch Ln
- 1037 Astro Ct
- 0 Pinhook Rd NW Unit 9686-E 20174622
- 8532 Red Bud Rd NE
- LOT 560 Neptune Cir
- 561 No Address Unit 561
- 0 Liberty Church Rd Unit 9615 20169497
- 107 Church St SE
- 674 Archery Ct
- 0 Pack Rd NE Unit 9628-E 20178378
- 0 Pack Rd NE Unit 9628-F 20178383
- 57 Highland Tree Ct
- 1009 N Cut Dr
- 248 Stirratt Rd
- 254 Oxford Cir
- 255 Oxford Cir
- 253 Oxford Cir
- 208 Oxford Cir
- 733 U S 411
- 733 Highway 411
- 1097 U S 411
- 689 Highway 411
- 689 Us Highway 411 NE
- 689 Us Highway 411 NE
- 689 U S 411
- 637 Us Highway 411 NE
- 637 Us Highway 411 NE
- 637 Us Highway 411 NE
- 637 Us Highway 411 NE
- 999 U S 411
- 637A Hwy 411
- 637 Highway 411
- 637 Highway 411
- 857 Us Highway 411 NE
- 861 Us Highway 411 NE
- 886 Us Highway 411 NE
- 0 US Hwy 411 NE Unit 3242531
- 888 Us Highway 411 NE